
In the previous article, we addressed the seven types of trend continuation patterns used in binary options trading. Let’s proceed with six more binary trading patterns — this time, to spot an upcoming change in the trend direction.
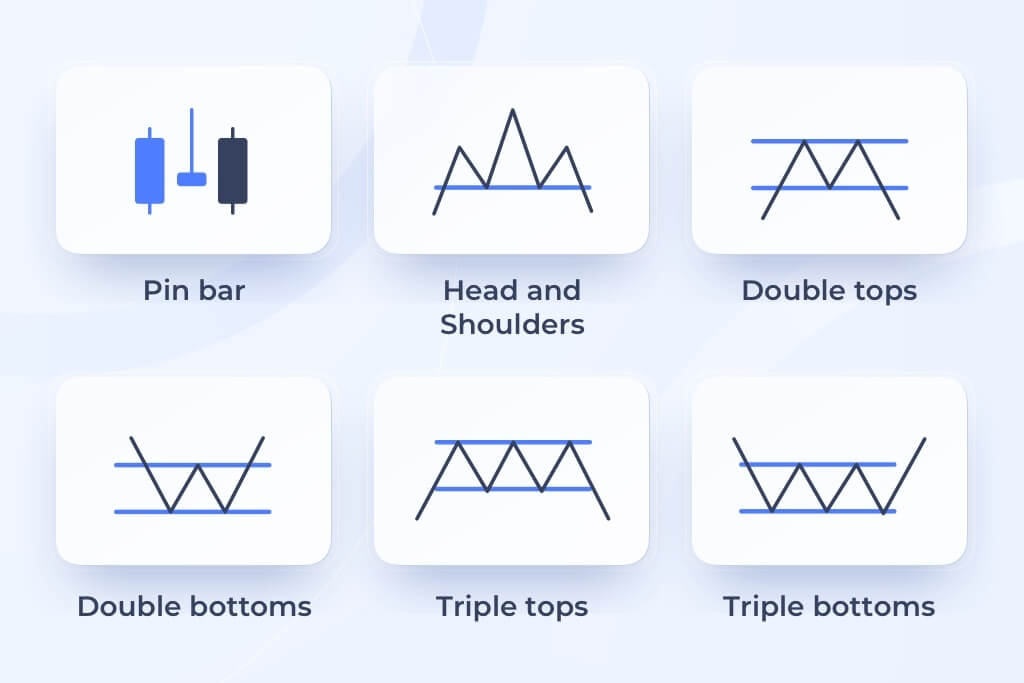
Pin bar
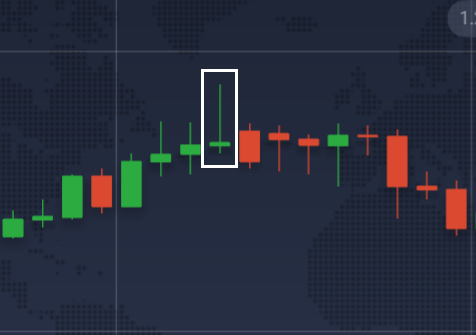
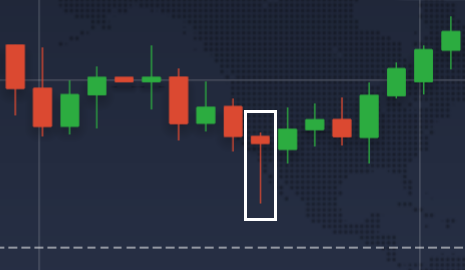
A pin bar is a candlestick formation indicating market oversaturation and imminent reversal. It looks like a candle with a petite body and a very long shadow.
chart, unlike many other candlestick patterns.
Distinctive features:
- A tiny candlestick body. This suggests that the price has found an equilibrium position — the bulls don’t want to pay more and are fixing positions, which means that the trend is soon to change the direction;
- Long shadow on one side. The body should be 20-30% the length of the shadow or less;
- Short or no shadow on the backside.
Remember Pinocchio, a boy whose nose would grow whenever he’s telling a lie? No wonder the Pin Bar pattern is also called Pinocchio Bar: whenever you see such a long “nose” on the chart, you can tell it’s lying to you about the future trend direction.
Press Higher when:
- There is a strong downtrend;
- The pin bar shadow is directed downwards;
- The previous candlestick is in the direction of the main trend;
- The next candlestick is in the opposite direction.
Press Lower when:
- There is a strong uptrend;
- The pin bar shadow is directed upwards;
- The previous candlestick is formed in the direction of the main trend;
- The next candlestick is in the opposite direction.
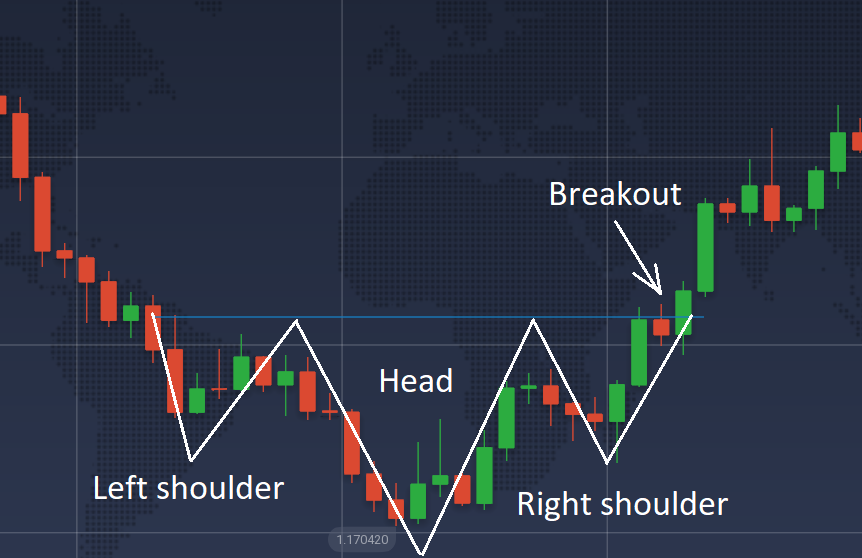
Head and Shoulders
Another one of the binary options chart patterns is named after the shape it resembles. The Head and Shoulders pattern has three peaks (two “shoulders” and a larger “head”) and a neckline representing the support level. It signals a high probability of a reversal for a current uptrend, i.e., that the prior uptrend is now likely to end.

Pattern formation
- When the price gets too high for the current market conditions, bulls step back, giving way to bears that pull the price down. If the price tests the downside and then bounces back, we get the left shoulder of the pattern.
- The bulls make another attempt to push the price up. This is how the head is formed.
- Weakened but not yet defeated, the bulls try to push the price to a new high, shaping the right shoulder. It would be lower than the head.
- Bears take over and pull the price down. They are too strong now, so they break the neckline.


Once that happens, you know the trend will continue to go down for a while. This is the right time to press the Lower button.
The Head and Shoulders pattern can also be inverted. It looks the same, but mirrored, and signals an upcoming reversal of the bearish trend.
Once the price breaks the neckline from below, you know it’s a bullish trend signal. Press the Higher button.
Double top/bottom
The pattern indicates an upcoming mid to long-term trend reversal. It’s easy to spot on the chart: the double bottom is formed by two equally or almost equally sized lows and looks like the letter W, and the double top is two highs that look like the letter M.
This pattern forms after a lasting stable trend:
- In the double top, the price attempts to break the resistance twice and bounces back because the resistance is too strong. After that, we can expect a new downtrend.
- Similarly, the double bottom is formed when the price tries to reach the support levels, and after the second unsuccessful attempt, it changes its course to a new uptrend.

- Open a Call/Higher option when the price closes above the neckline.
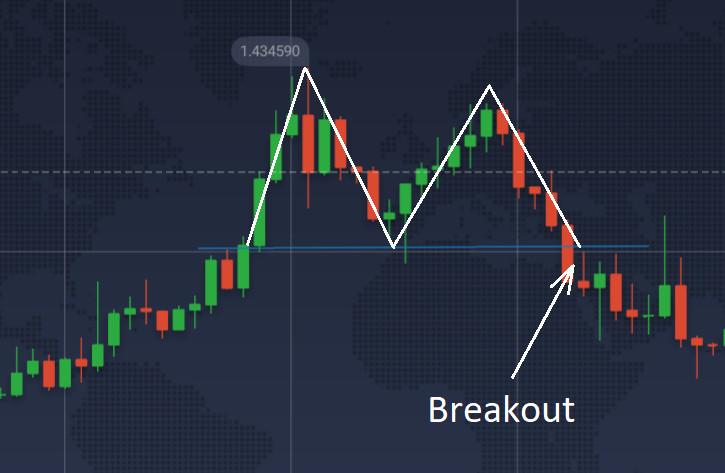
- Open a Put/Lower option when the price closes below the neckline.
Triple top / bottom chart patterns
Triple tops and bottoms binary trading patterns are very similar to the double ones. Similarly, they are the sequence of three highs or lows that try to break the resistance or support and signal the current trend reversal.
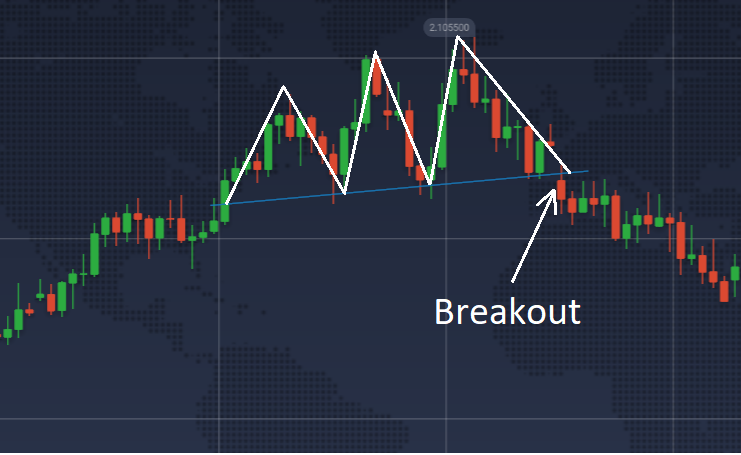
- Open a Call option when the price closes above the neckline.
- Open a Put option when the price closes below the neckline.
Triple tops and bottoms are less common than double tops and bottoms and often mislead inexperienced traders. When two peaks are formed, many amateurs don’t see the third one coming and end up opening a losing trade. Therefore, it is important to be patient and gain experience and trading intuition.
Conclusion
Trend reversal patterns help spot the moment when the trend is going to change its direction and act fast. Head and Shoulders, Double and Triple tops and bottoms, and Pin bar patterns can give reliable signals as long as you are attentive enough to see them on the chart.
For better results, train yourself to identify patterns on the chart using the Practice account, and couple them up with technical indicators. For example, reversal patterns work well with the Moving Average indicator, Stochastic, and RSI.

