
Though market behavior may appear hectic, it is undoubtedly influenced by mass psychology. Traders buy assets with high expectations of the price skyrocketing, then often panic-sell when things don’t seem to be going well. Such behavior is repeated over and over again, so it is not surprising that back in 1930 an American economist Ralph Elliott assumed that there is a certain reason for every market trend. He decided to analyze market cycles to find any possible repetitions in the movements.
The formation of the theory
Elliott began analyzing charts covering the last 75 years of market data in order to study the nature of market movements. He believed that market cycles could be recurring much like the behavior of investors.
In May 1934, the results of Elliott’s observations began to form a general set of principles of the stock market behavior. They were published in a book called “The Wave Principle” that explains the method in great detail. The book describes patterns that occur repeatedly and explains how to determine them correctly.
How does it work?
Ralph Elliott suggested that trends in financial prices result directly from investors’ psychology. Elliott found out that swings in mass psychology always show up in the same patterns: prices move in impulsive (motive) and corrective ways. The price movements that repeat one after another are called waves. They can be split in two types.
Motive waves consist of 5 waves: 3 large price movements in the direction of the uptrend and 2 corrections. These waves are labeled waves 1, 2, 3, 4 and 5 respectively. There are several rules to note when finding these waves:
- The third wave (second impulsive wave) is usually the largest of the sequence. Waves 1 or 5 cannot be longer than wave 3.
- When the wave 3 is the longer impulse wave, wave 5 will be almost equal to wave 1 in length.
- The structure for waves 2 and 4 will alternate: if one is a sharp correction, the other one will be a flat correction and vice versa.
- The high of wave 3 must be higher than the high of wave 1 (otherwise it is necessary to start the wave count again). The waves should be making progress.
Corrective waves consist of 3 waves: an impulse down, a correction to the upside and another impulse down. These waves are labeled A, B and C. As a rule, corrective waves A, B and C usually end in the area of the prior wave 4 low.
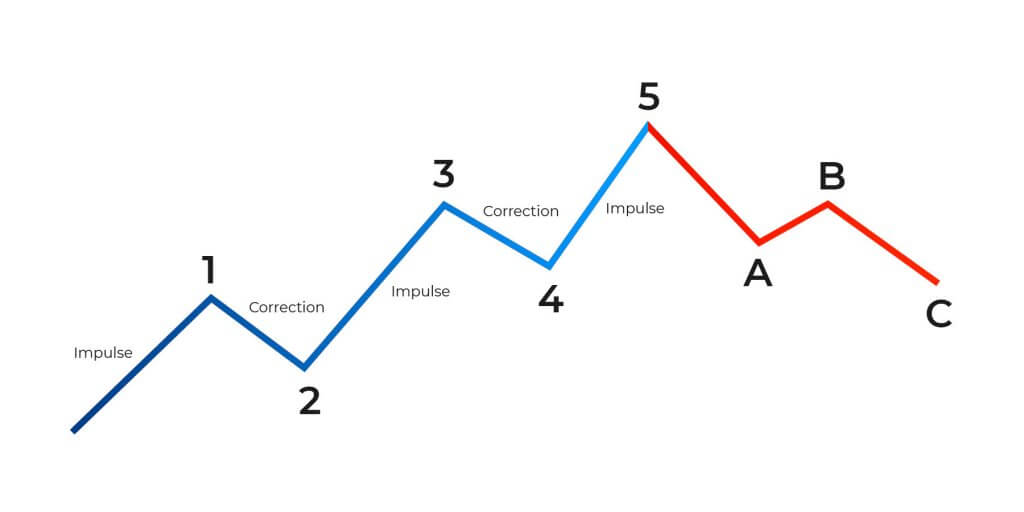
Both motive and corrective waves can be seen in the picture above. It is important to note the length of the waves as well as their proportions. Wave 2 is typically 60% the length of the first one. Wave 3 is usually much bigger than wave 1 and wave 4 that comes next is usually 30% or 40% of wave 3. The same rules are applied for a downtrend.
How to open a deal?
In order to trade with this method, traders need to practice determining the waves on the chart. Each wave must correspond with the above stated criteria exactly. Before opening a deal, traders need to double check the rules to make sure they found the pattern correctly. If the waves do not correspond with the rules, the pattern is determined incorrectly and you need to start over.
The wave structure suggests that the price moves in cycles. For example, after three big moves to the upside, the upturn trend is likely to be near its end and the prices are likely to move lower.
For a downtrend, it would be the opposite: after three big moves down, the downtrend is likely to be over and the prices might start moving higher.
The waves help to determine the trend direction and a possible moment for an entry. These movements are fractal, which means that they can be found both on larger and smaller chart types. If you trade short timeframes, you can look for this pattern, too. However, usually it is much easier to notice on larger timeframes.
For instance, you may witness this structure on a monthly Amazon chart. It is clearly visible that the price first climbed upwards in a cycle of 5 waves, followed by the 3 corrective waves.

Finding the Elliott Wave pattern can help you with making decisions regarding the future deals.
Once you determine the wave pattern, you can enter Buying positions during the pullbacks (corrective waves like wave 2 and 4) during uptrends. This, if done correctly, may allow you to “ride” the next uptrend as the price rises to the next high.
As for Selling deals – you can execute them during corrective waves in a downtrend to profit from the market trending down.
Conclusion
The Elliott Wave Theory might seem more complicated than conventional strategies used by beginner traders. This theory does require a lot more practice, because the main concept lies in determining the wave sequence correctly. However, it gives a great insight into the market behavior. It allows more experienced traders to plan their trading strategy ahead, in accordance with the market cycles.

