
Technical indicators come in all shapes and sizes so it can be hard to narrow them down to just a couple. Indicators of different categories serve various purposes: some show the trend direction, others reflect the strength of the trend or the volume. Today, Santa’s little helper Rudolph the red-nosed reindeer would like to share the top-3 technical indicators for beginners.
These indicators can serve as the basis for any strategy, since they cover most of the information you need to know about the asset. They can be used together and on their own, as well as combined with other tools.
Trend indicator: Moving Average
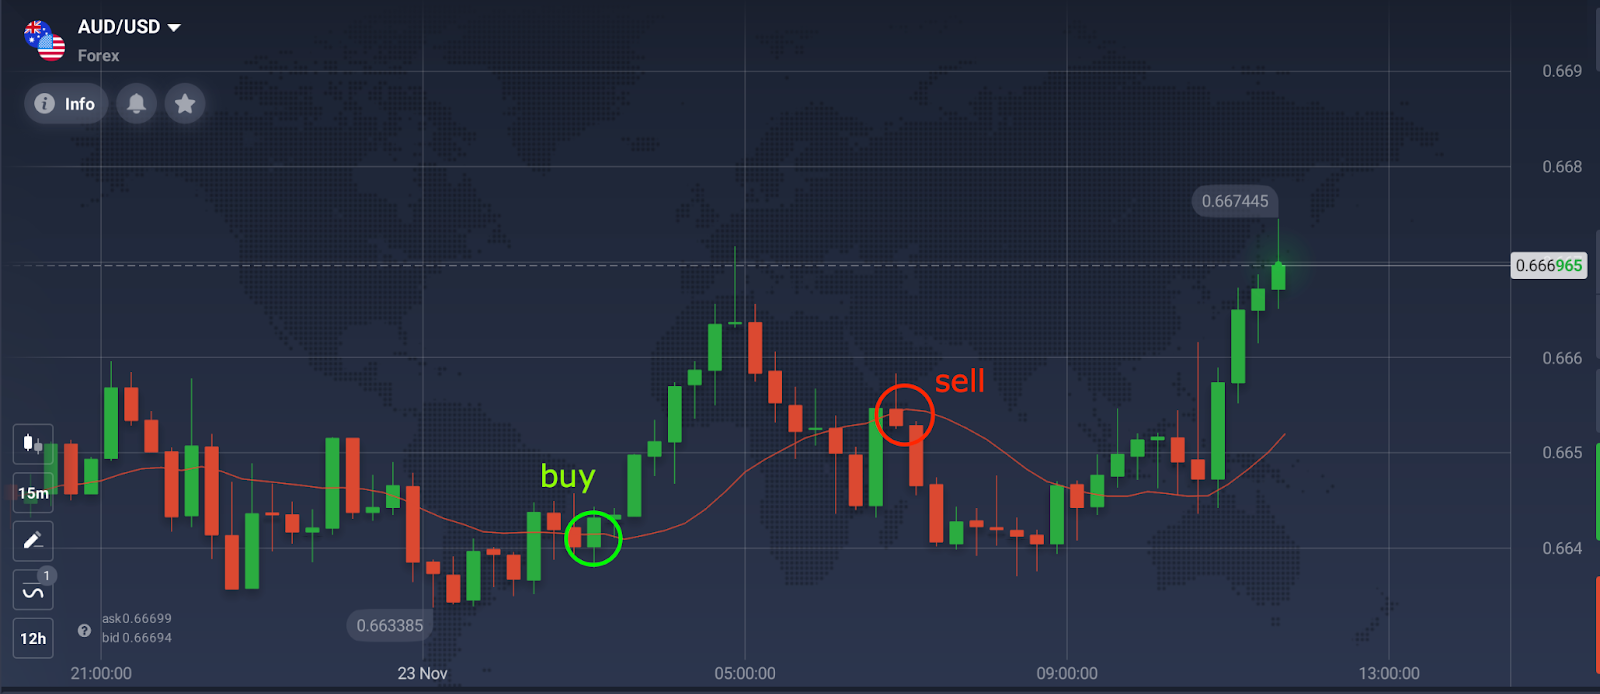
Why use it: Trend indicators can be used to determine the direction in which the price is going. The Moving Average is one of the most uncomplicated trend indicators that consists of just one line. It is easy to understand and configure according to your needs, which is why it is one of the most popular technical indicators for beginners.
How to use: Choose the Moving Average in the list of indicators on the trading platform of your choice. You can leave the default settings or adjust them depending on your strategy. To read its signals, wait for crossovers of the indicator line with the price chart. When the price chart crosses the indicator line upwards from below, and the color of the candlesticks is green, it may be a signal to “Buy”. When the price chart crosses the indicator in a downward direction, and the candlesticks are red, it may be a signal to “Sell”.
Momentum indicator: RSI
Why use it: RSI is an indicator that helps to measure the strength of a trend and determine whether it will reverse soon. It shows the overbought and oversold areas of the asset, which helps traders to make a more accurate prediction.
How to use: To interpret the RSI signals, pay attention to the levels of 30 and 70 and their crossovers with the indicator line. When the indicator line approaches the level of 30 and crosses it upwards from below, it means that the asset is oversold and the price of the asset may soon start growing. A trader may consider “Buying” at this point. A “Selling” position can be opened when the indicator line approaches the level of 70 (asset is overbought) and crosses it downwards from above.

Volume indicator: Weis Wave Volume
Why use it: Understanding the supply and demand of the traded asset is important in order to spot possible turning points in the asset price. Weis Wave Volume takes the market volume and organizes it in visual charts that help follow the direction and strength of the trend better.
How to use: Weis Wave Volume will display green bars when the asset is in an uptrend and red bars when the asset price is falling. When the trend gains maximum strength, the volume bars will reach their tallest. After that, the direction of the asset price can be expected to reverse.

Rudolph reminds: there is no indicator that always gives out perfectly accurate signals. Make sure to utilize appropriate risk management tools and don’t invest more than you are prepared to lose.

