
If you’re guessing whether that trend is going to keep on rising or collapse like a house of cards, the ADX indicator might be your ultimate solution. Let’s see what ADX is and check out some examples.
ADX indicator explained
“ADX” stands for Average Directional Index, and it helps you measure the strength of a trend. It’s not just about figuring out if the market is going up or down; it’s about understanding how strong that movement is and if it’s smart to ride that wave.
The ADX is calculated using a moving average of the price range expansion over a given period. Typically, this period is 14 bars.
The ADX indicator formula
The ADX is calculated using a moving average of the price range expansion over a given period (typically, 14 bars). Don’t worry, the IQ Option platform does all the math for you.
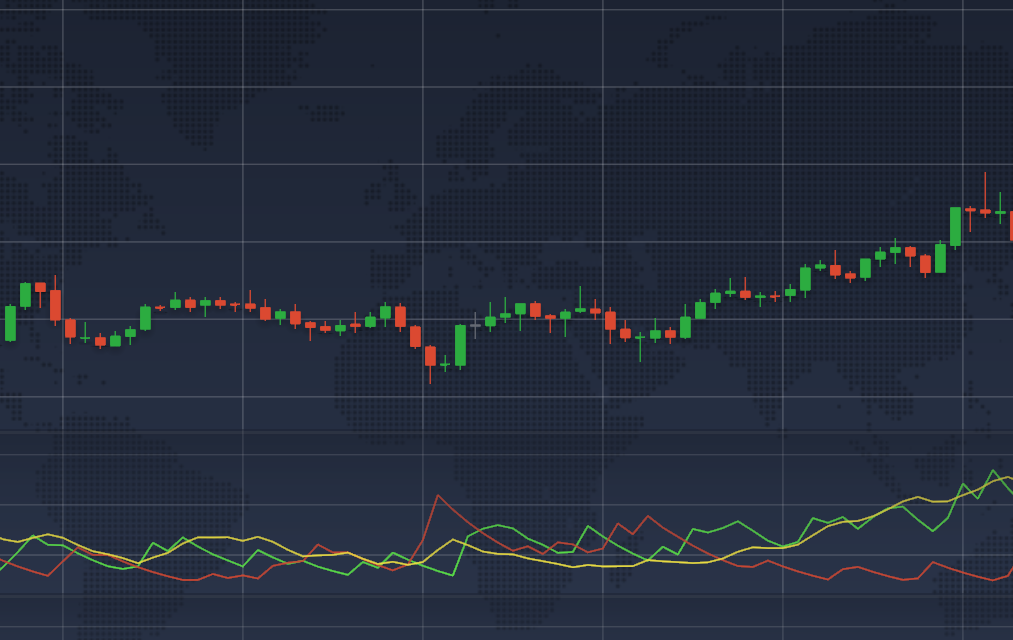
The indicator consists of 3 lines:
- Main line (yellow) shows the overall trend strength.
- +DI (green line) measures the strength of upward movement.
- -DI (red line) Measures the strength of downward movement.
ADX indicator: how to use
The ADX indicator ranges from 0 to 100:
- A reading below 20 usually means the trend is weak or non-existent.
- A reading above 40 indicates a strong trend.
Here’s a step-by-step guide on how to use the ADX indicator:
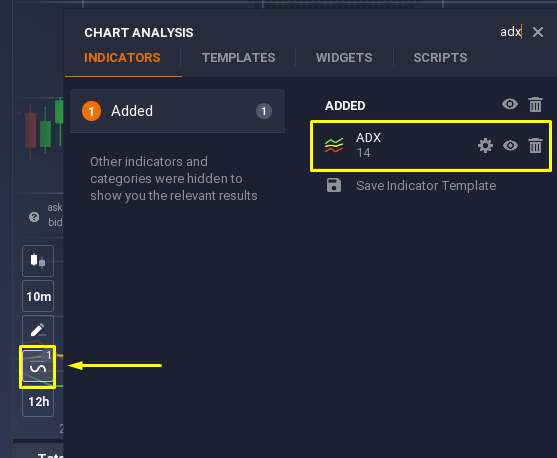
- Apply the ADX indicator.
Head to the Indicators section of your Traderoom and select ADX from the list.
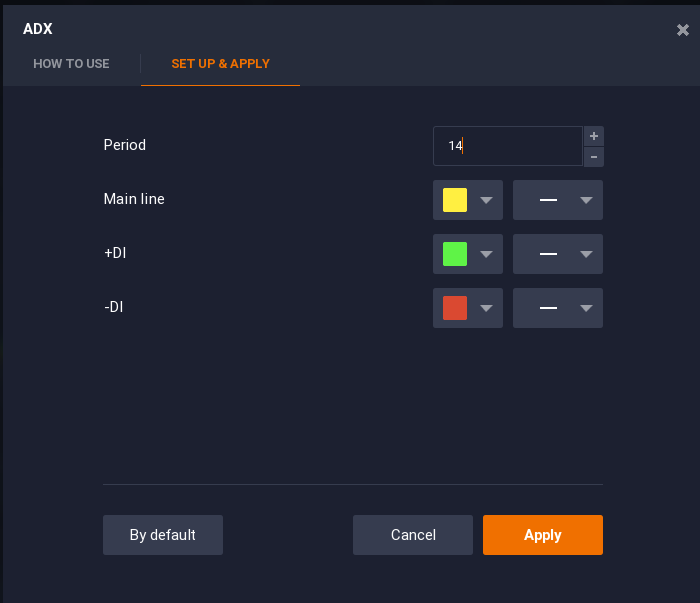
Adjust the settings. The default setting is 14 periods, which works great for most traders. You can increase the period — this will make the ADX more accurate, yet less sensitive.
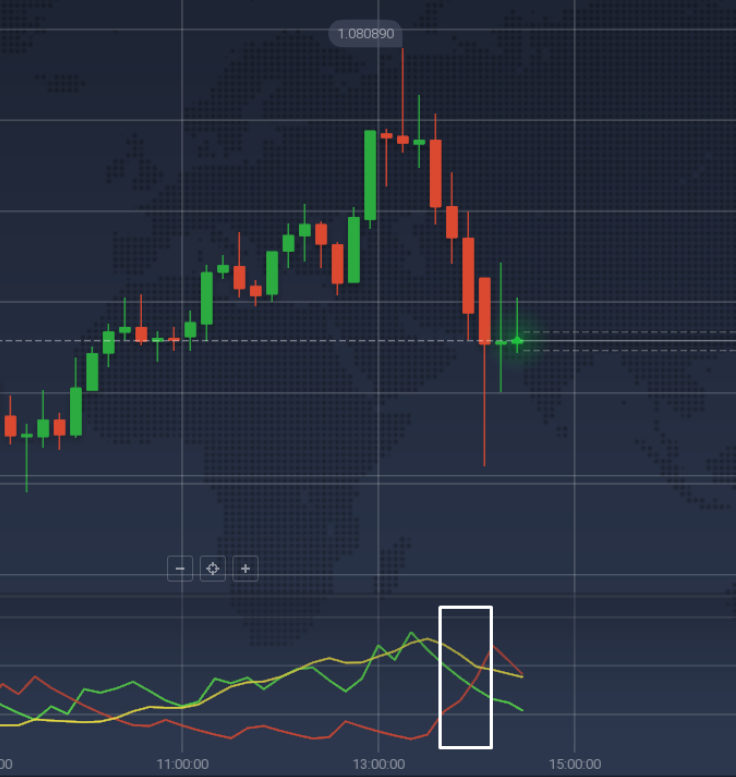
- Analyze the strength of the trend. First, look at the main line (yellow). If the main line is rising, the trend is gaining strength. If it’s falling, the trend is losing strength. To measure the strength, look at the ranges:
- 0-25 — Absent or weak trend
- 25-50 — Strong trend
- 50-75 — Very strong trend
- 75-100 — Extremely strong trend
- Analyze the trend direction:
- When the +DI line is above the -DI line, the market is likely in a bullish phase.
- When the -DI line is higher than the +DI line, it indicates a bearish market sentiment.
- When the +DI and -DI lines cross, it could signal an upcoming trend reversal. This information can be used to identify the optimal moment to enter or exit a trade.
ADX indicator strategy
ADX works best when used in a strategy alongside other indicators like moving averages, Parabolic SAR, or RSI. Let’s check out an example of using ADX + RSI indicator combo.
RSI is a single line dancing between 0 and 100 on a chart. The closer this line gets to zero, the more likely the asset is to be oversold, which means everyone is selling it.
On the flip side, when the RSI approaches 100, it suggests the asset is overbought — basically, people are buying it like it’s Black Friday.
What does this mean for you?
- When the RSI is hanging out near zero, it might be a good time to consider buying because the asset price could be about to go up.
- When it’s near 100, you might want to think about selling, as the price could be heading down soon.
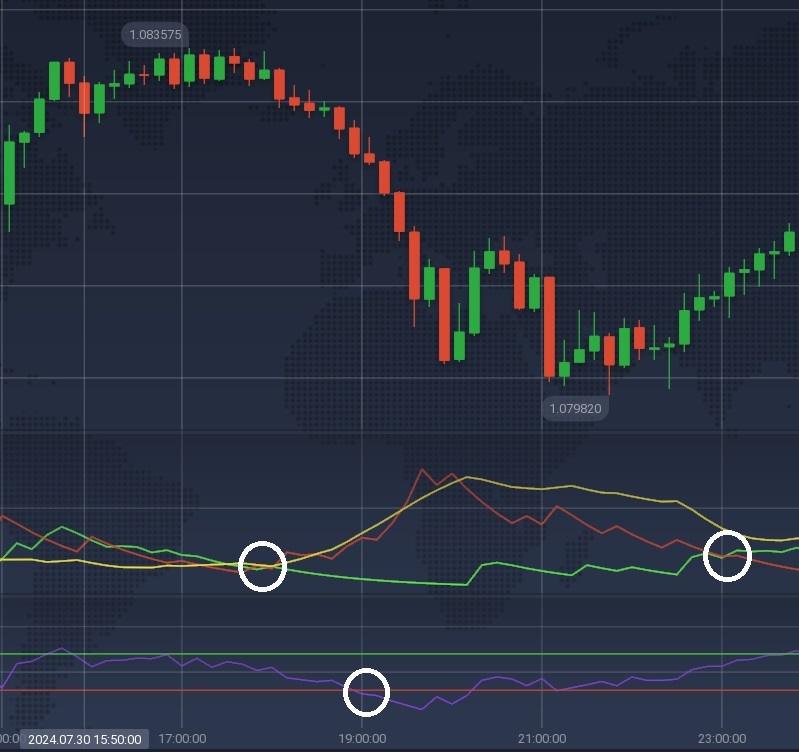
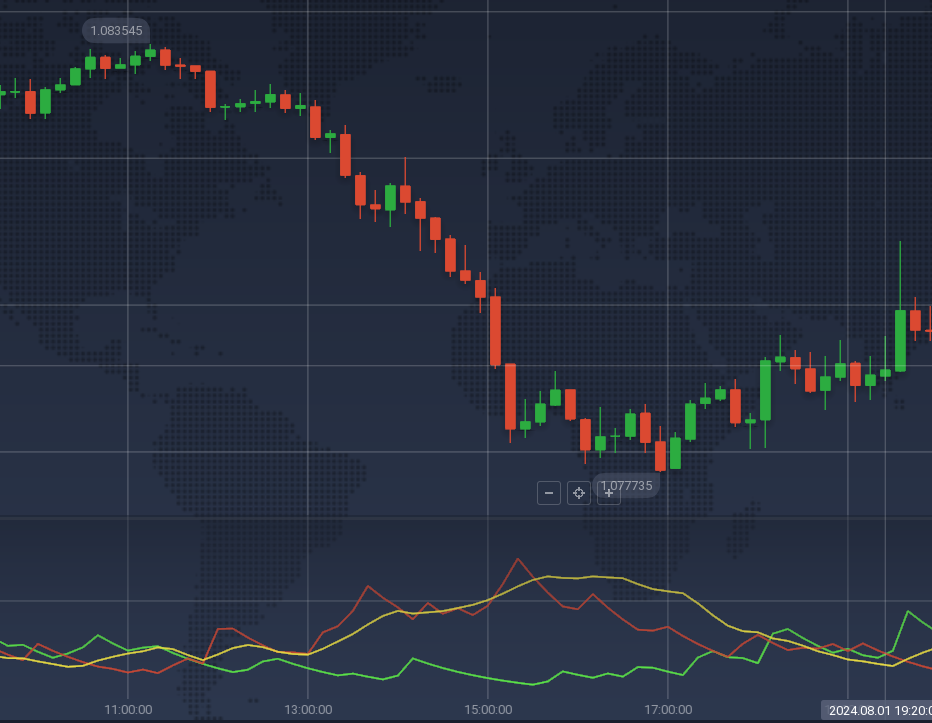
On the chart, ADX showed us a strong bearish trend. Soon, RSI entered the oversold zone, indicating a possible trend reversal. And indeed, after a while, we see how the green line of ADX crosses the red line from below, just at the beginning of a bullish reversal. This could be an opportune moment to open an Up trade.
Conclusion
The ADX indicator explained in simple terms is a tool that helps traders determine the strength of a trend in the market. It also aids in identifying trend direction and potential reversals. However, for best results, it’s advisable to pair the ADX with supplementary indicators for confirmation.

