
The RSI indicator is an oscillator that is used to measure the strength of a trend and determine the overbought and oversold levels for a security. RSI consists of two levels with the indicator line in the middle.

It is one of the most used indicators since it is simple to operate with and can be combined with many other indicators to form technical analysis strategies for different types of traders.
How to interpret RSI signals
RSI offers a trader an insight into the asset’s performance. It is important to understand the indicator’s settings to know how to use RSI. The indicator’s line (purple) fluctuates in a price corridor between 0 and 100%. The closer the indicator gets to 100, the more likely it is for the asset to be overbought, and the other way around: the closer to 0, the more chances that the asset is oversold.
Standard approach
There are two levels that the trader should be paying attention to: the levels of 70 and 30 (some traders adjust the indicator to 80 and 20, which we will explain a bit later).
- Level 70 (green line) marks the overbought zone of the price fluctuation. It is considered that if the price approaches the level of 70%, it will then reverse and start depreciating.
- Level 30 (red line) marks the oversold zone of the asset: when the indicator is approaching it, the price is expected to change direction and start growing.
A signal to buy the asset is received when the indicator approaches the oversold area, whereas when the indicator is in the overbought area, a trader may consider selling.
Example
Let’s look at the example with Tesco stock (TSCO.L). Signals to buy and sell may be noticed when the indicator touches or crosses the levels of 30 and 70, respectively.
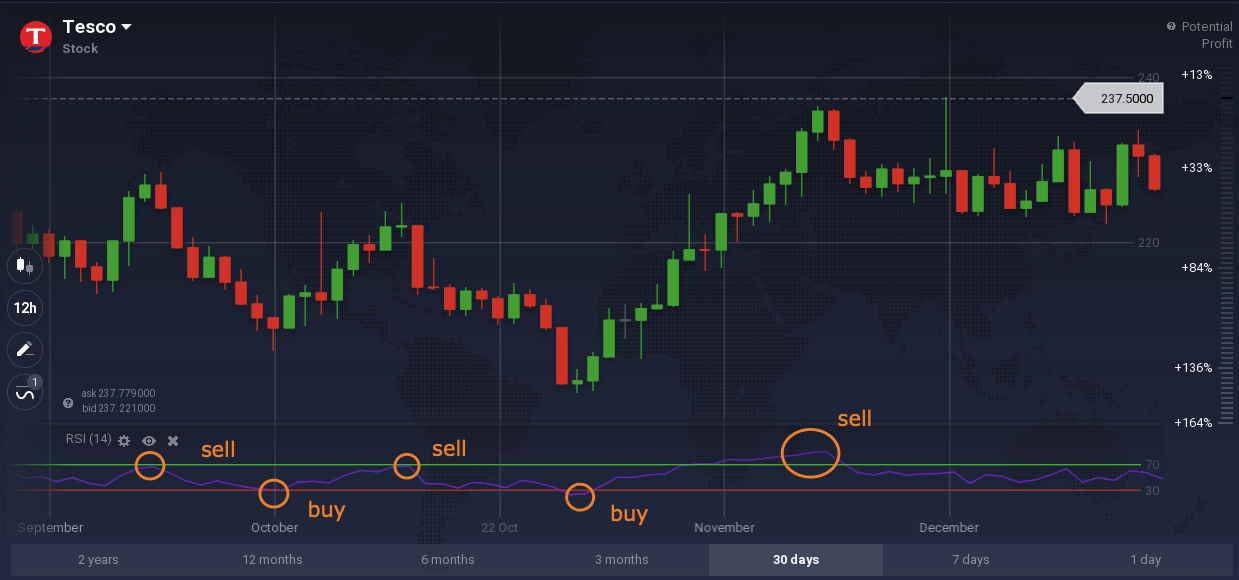
We can see that after the indicator shows a reverse, the price actually starts going in the opposite direction. However, it is important to note that the indicator may stay in the overbought or oversold area for a longer period of time.

“Safe” approach
Another way to set up RSI is to replace the levels of 70 and 30 with 80 and 20. It is important to specify that by no means does this approach guarantee better results than the standard one. This setting is used by traders in order to adjust the indicator to be less sensitive to price fluctuation. It’s true that this approach might help to avoid false signals, but it can deprive you of some valid signals as well.

As you can see, with these settings, the indicator filters out some price movements: the same signals that were received with the 70/30 setting are not present with the 80/20 approach. However, this may be attractive to traders, who value the quality of signals over their quantity.
RSI and other indicators
The Relative Strength Index indicator measures the magnitude of recent price movements, which makes it prone to false signals. In order to avoid, or at least minimize their amount, traders combine RSI with other indicators. This allows to build indicator combinations that work for different assets and different timeframes. Let’s look into some of the indicators, that work well combined with RSI.
Moving Average
Being a leading indicator, RSI works well with lagging trend indicators. Moving Averages can be used in order to confirm the signals received from RSI. In order to work with these two indicators, one may apply two Exponential Moving Averages of 5 and 10 periods, respectively.
A crossing of the 10 EMA (green) by 5 EMA (blue) from above below confirms that the trend is reversing downwards and may signal an opportunity of an entry for a selling deal. An upside crossing from below above will mean the opposite, considering that RSI is also showing a reversal.
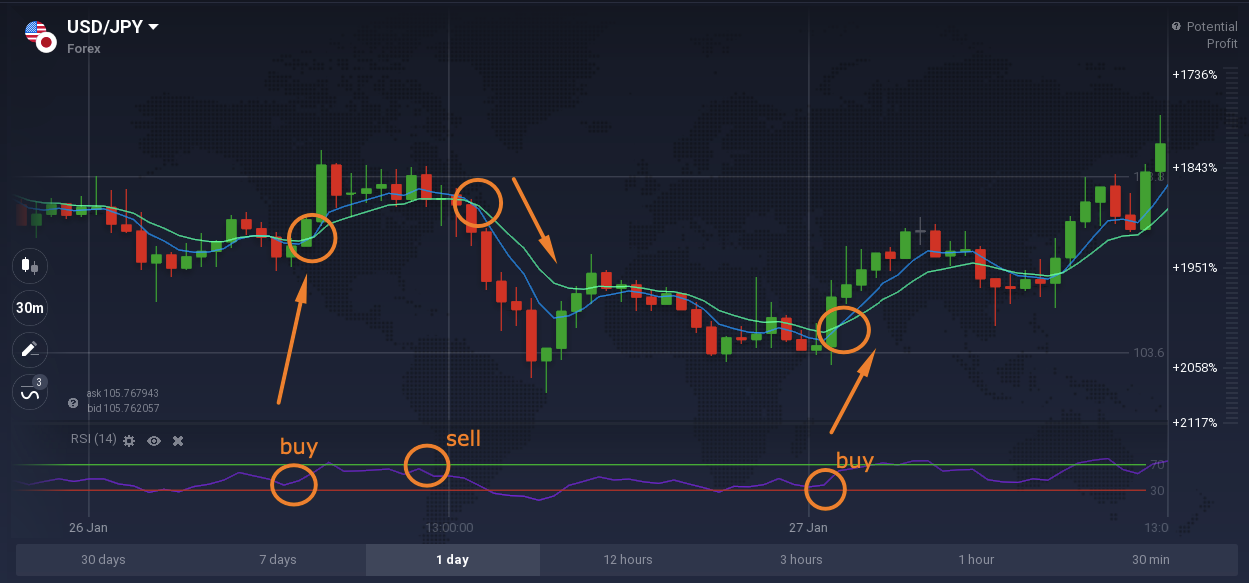
In the example above you can see that RSI, as a leading indicator, shows the potential trend direction reversals, which get confirmed by the EMA crosses.
You may play with the MAs’ periods, setting them on higher or lower periods for different types of trading (long or short term).
Stochastic
The Stochastic indicator serves a similar purpose as RSI — it defines the overbought and oversold levels for a security, however, its calculation includes the highs and lows in the recent range, allowing it to be a useful tool in a flat market.

Using the two indicators together may help the trader to confirm RSI’s signals during strong trends and to find opportunities during sideway trends. A signal to buy is received when both indicators are in the oversold are, and vice versa — a signal to sell is received when the indicators are approach the overbought zone.

The setup
In order to set up RSI on the IQ Option platform, simply find it in the indicators menu in the “Popular” section. You can utilize the indicator with the default settings or change them according to your preference.

It is possible to change the overbought and oversold levels as well as the base line period (14 by default). The colours of the indicator are customizable, too.

