
One of the most vital topics in trading is recognizing entry points for opening deals and finding the best time to step out of the market. As a fact, one sole indicator can not show you the correct signals to believe in. However, a mix of indicators and graphical tools can provide you with quite trustable predictions that you may use in trading.
Here we will show you how to make Fibonacci lines, Average Directional Movement Index (ADX), and Parabolic SAR indicators work for you in the best way possible. Learn how to use this trading strategy in practice and check out the example for reference.
ADX and Parabolic SAR
We have already learned about the nature of Fibonacci lines. Let’s see what ADX and Parabolic SAR can bring to the table.
The ADX indicator shows the strength of a price trend. A downward trend can be expected when the red ADX line crosses the green line from below and stays above it. An upward trend is more likely to appear and continue when the green line is above the red line.
Following Parabolic SAR, you can see which trend the price is more likely to be in. If it is a downward trend, then blue dots appear above the chart. And when the trend is reversing upwards, the dots appear under the chart.
How to apply and read signals
On the IQ Option platform, you can find ADX and Parabolic SAR in the Indicators tab — Trend. Fibonacci lines can be applied from the Graphical tools tab.

So how to read signals and use these tools together? Let’s check the example of a Fibonacci, ADX and Parabolic SAR strategy below.
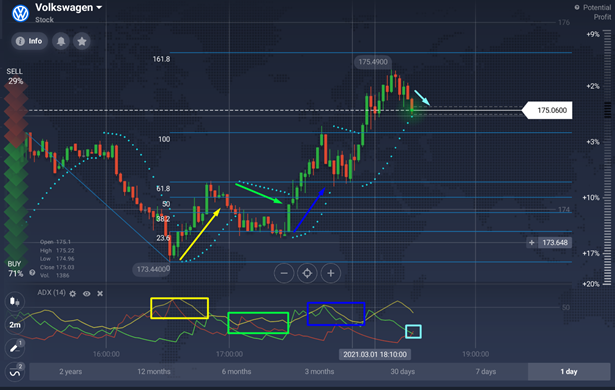
We have applied Fibonacci Lines according to the downward trend that has been indicated previously. ADX and Parabolic SAR have been applied to the chart as well.
On the image, we can see when the price was supposed to grow according to Parabolic SAR and ADX and which Fibonacci levels the price touched. How can we check that?
The explanation
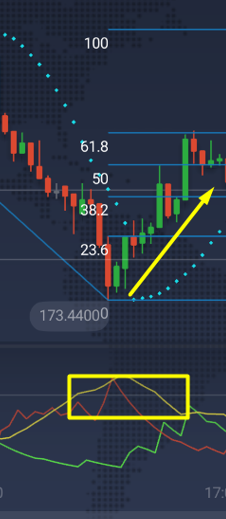
The first (yellow) reversal was predicted to be downward. To indicate that we need to read the signals. The red ADX line was above the green line and showed a higher probability of a downward trend to continue. Despite Parabolic SAR being below the chart, the price indeed went down after testing the Fibonacci 50 and 61.8 levels.

After that, the next reversal (green) appeared. It had a strength according to the ADX red line which was above the green ADX line. The Parabolic SAR proves our expectations as well by showing a downward trend (dots appeared above the chart).
If we check the Fibonacci lines, we will see that the price fluctuated at levels 23.6 – 38.2. That showed that the asset price tested previous levels but after that jumped back to the medium level of the Fibonacci tool. And that proved that the trend was quite stable as well.

The following (blue) reversal started with Parabolic SAR appearing below the chart. The trend strength was proved by the green ADX line above the red ADX line as it is highlighted. Also, a new level of Fibonacci lines has been breached – the price was above the 61.8 level.
Since it was the second time when this level has been reached, it could be a signal that soon the upward trend will be leading for that asset. And that could be a signal to be prepared to open a Buy deal or close deals if they were opened for Sell.

And finally, according to the data, a new price and a trend reversal could be expected for that asset. The Parabolic SAR is about to appear and it is likely to be above the chart as we can see that 2 red candles formed and the green ADX line has just crossed the red ADX line. The downward price strength was weak, so we need to check the levels of Fibonacci to make our decision.
Here we have to pay attention to the fact that the Fibonacci level of 61.8 has been reached twice and that the last possible reversal is happening when the level of 100 has been breached. Based on that, the last reversal, a change back to an upward trend could be expected since Fibonacci levels have been breached drastically.
Conclusion
Fibonacci lines, Average Directional Movement Index (ADX), and Parabolic SAR work well in collaboration, complementing each other. They may provide you with the signals when the trend is most likely to continue or reverse so you could construct the best strategy of trading.
Please, remember, there is no indicator or strategy that would guarantee 100% success. Trading is risky and therefore should be treated accordingly – you need to practice and remember about risk management at all times.

