
Overview
In general, markets tend to form various patterns as a result of the market traders’ (buyers and sellers) psychology. For example, it can be observed when prices reach a certain market level, while buyers and sellers are indecisive on what the next move is. This would often result in the formation of a temporary stalemate or pattern in which both buyers and sellers would try to resolve who has the upper hand. So there are two major categories of popular trading patterns;
- Trend continuation patterns which will eventually lead to the continuation of the existing trend. These include symmetrical triangles, ascending or descending triangles, flags and pennants.
- Trend reversal patterns which will usually result in the change in the trend’s direction or a reversal. These include the head and shoulders pattern, double or triple tops and bottoms as well as falling and rising wedges.
Both categories include various designs and variations. Getting to know the most common trading patterns that have a higher probability of success is the key here.
Why trade with patterns?
Patterns tend to be one the best methods for getting a valid and timely buy or sell signal and offer the ability to place precise price targets for stop loss and take profit targets. While many traditional indicators offer signals for entry on a trade, no indicator provides take profit targets. Moreover, there is a saying amongst seasoned traders:
”Getting into a trade is easy. Anybody can do it. Knowing when to get out is the tough part.”
Thankfully popular chart patterns offer both the trade entry and exit solution to traders.
Continuation Patterns
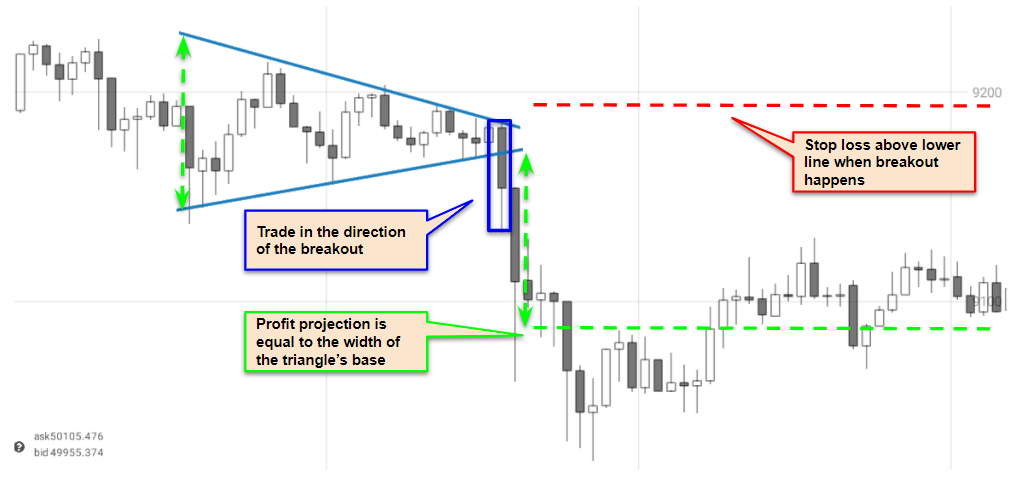
Symmetrical triangle
Usually symmetrical patterns are a continuation pattern, meaning that as the trendlines come closer and converge, the inevitable breakout will happen on the side of the prevailing trend. So if the patterns form during a bullish trend, this means that the breakout will happen on the upper part of the triangle.
This is also in line with Elliott Wave theory where corrective wave 4 often forms as a symmetrical triangle pattern. The entry signal is given when the first candlestick closes outside the triangle lines. Then the stop loss should be placed below the opposite line and the profit target should be approximately equal to the width of the triangle’s base in the direction of the price breakout.
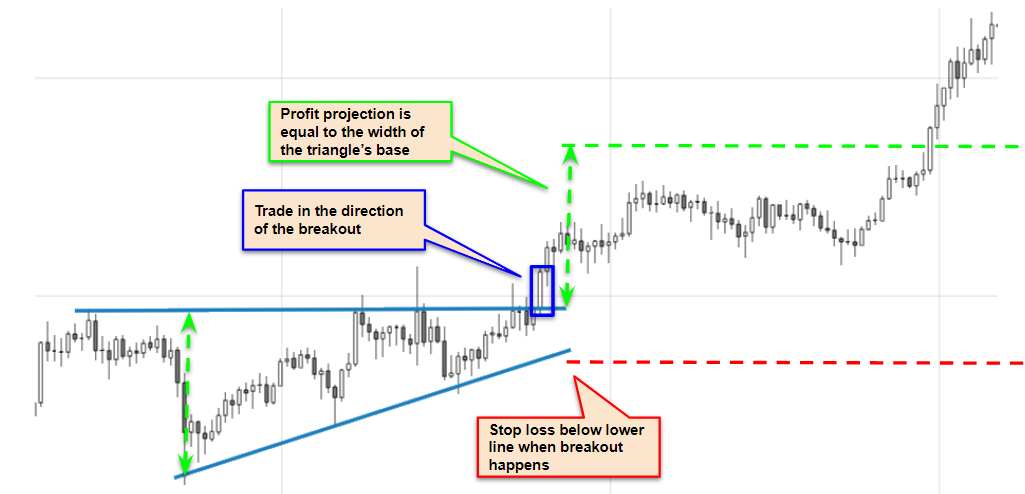
Ascending triangle
An ascending triangle is usually formed in an upwards trend when the market takes a small pause to resolve who has the upper hand. The fact that the upper line is flat and the lower line is rising shows that buyers slowly take the upper hand from sellers until the inevitable breakout happens on the upper side of the pattern.
It’s not unlikely that a fake breakout or rejection could happen on the wrong side of the triangle, so patience is required until prices breakout outside the triangle upwards. The entry signal is given when the first candlestick closes outside and above the triangle’s flat line. Then the stop loss should be placed below the opposite line and the profit target should be approximately equal to the width of the triangle’s base in the direction of the price breakout.
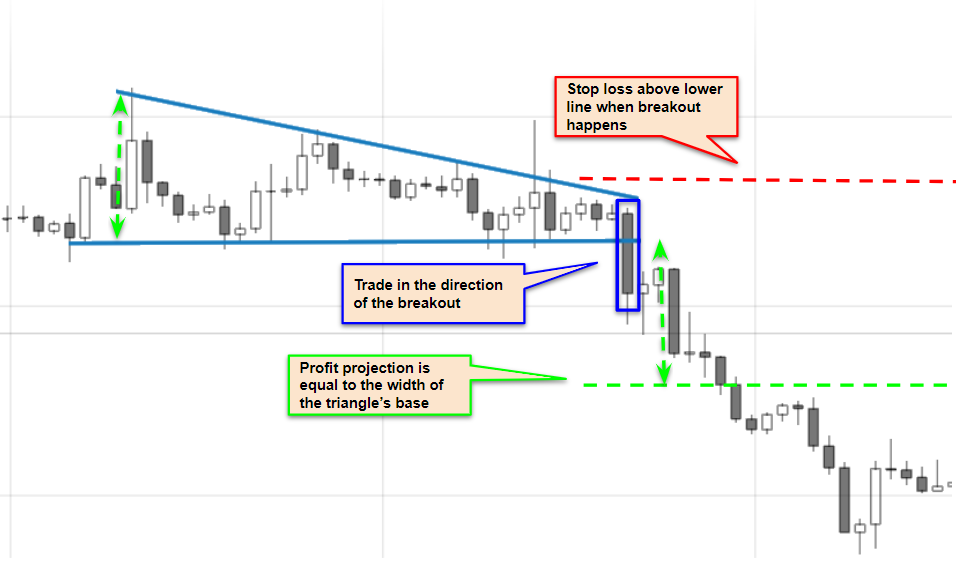
Descending triangle
A descending triangle is usually formed in a downtrend when the marker takes a small pause to resolve who has the upper hand. The fact the lower line is flat and the upper line is falling shows that sellers slowly take the upper hand from buyers until the inevitable breakout happens on the lower side of the pattern.
It’s not unlikely that a fake breakout or rejection could happen on the wrong side of the triangle, so patience is required until prices breakout outside the triangle downwards. The entry signal is given when the first candlestick closes outside and below the triangle’s flat line. Then the stop loss should be placed above the opposite line and the profit target should be approximately equal to the width of the triangle’s base in the direction of the price breakout.
Flags & Pennants
A flag is a small triangle after a strong and sharp upward or downward price movement. It behaves like a symmetrical triangle on the breakout but the profit target is not equal to the width of the base, which is very small, but rather is equal to the size of the pole or the movement that occurs before the flag.
Stop loss or exit of the trade in case it does not perform as expected is placed below the patterns’ lows if it’s a bullish flag, or above the patterns’ highs if it’s a bear flag. A pennant acts in the same fashion as the flag but its share looks like a falling micro channel or rectangle or a falling wedge. Stop loss and take profit targets are the same as with the flag.

Trend reversal patterns
Head and shoulders
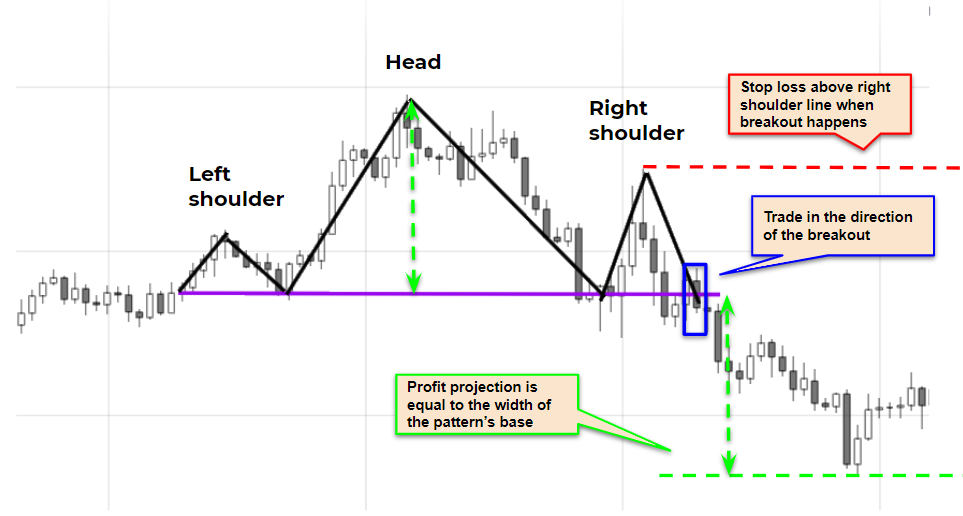
The head and shoulders is a pattern with strong statistical significance and accuracy. It’s a trend reversal pattern that usually happens at the end of a trend and signifies the start of the opposite trend.
It consists of three peaks. The right shoulder, the head and the left shoulder. Usually the peak resembling the head is the largest and the shoulder peaks are smaller, either similar in size or even different in size. The critical trigger for a signal is given when the price breaks below the neckline of the pattern in the case of the normal head and shoulders pattern or above the neckline in the case of the reverse head and shoulders pattern.
Take profit targets are placed at a distance that is equal to the distance between the head and neckline. The stop loss is placed above or below the right shoulders peak depending on the direction of the reversal.
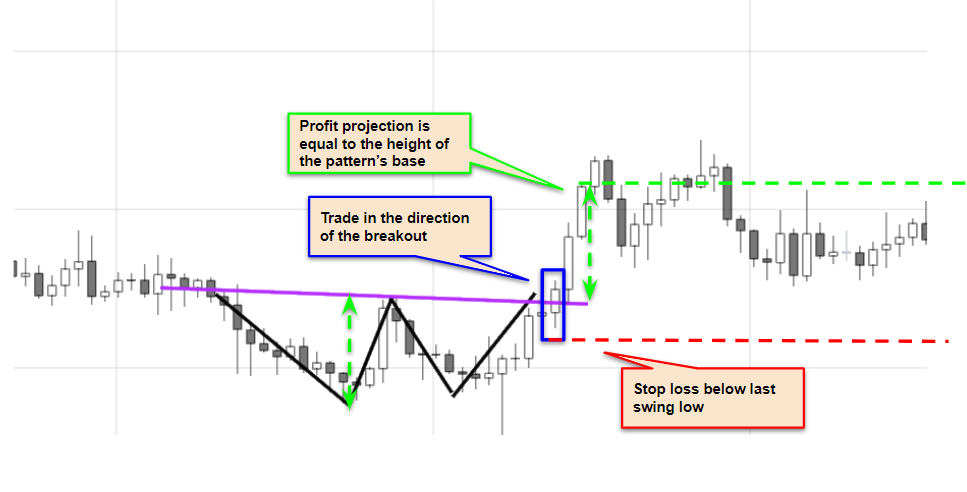
Double bottom
A double bottom is usually formed by two lows almost equal in depth and looks like the letter W. It forms at the bottom of a downward trend, signifying its end. The signal trigger happens when the price closes above the neckline. The triple bottom is a rarer variation of the double bottom with three similar lows.
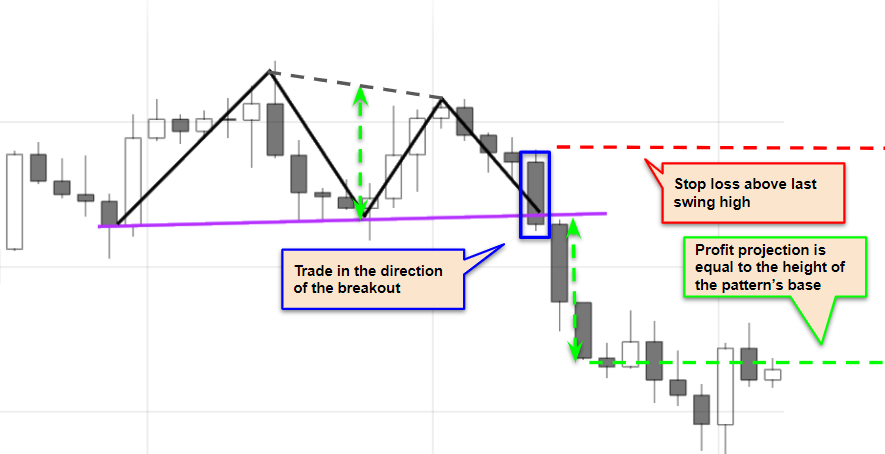
Double top
A double top is usually formed by two peaks almost equal in height and looks like the letter M. Its forms at the top of an upward trend signifying its end. The signal trigger happens when the price closes below the neckline. The triple top is a rarer variation of the double top with three similar peaks
Falling wedge
A falling wedge is usually formed by two falling trend lines that draw closer. The pattern signifies a drop in volatility or price movement as it approaches the narrow end. The breakout on the falling wedge usually happens on the upper side, which makes the pattern bullish.

Rising wedge
A rising wedge is usually formed by two rising trend lines that draw closer. The pattern signifies a drop in volatility or price movement as it approaches the narrow end. The breakout on the rising wedge usually happens on the lower side, which makes the pattern bearish.

Conclusion
Pattern trading offers the best of both worlds in terms of when to enter a trade and exit either with a profit or loss. It’s important to note that the difficult part of pattern trading is the correct recognition of the pattern.
As with each trendline, at least two points need to be connected, the same holds with the pattern lines. So in the case of a symmetrical triangle, two points must connect the upper line and two points must connect the lower line. The last point can be the one where the breakout happens.
Despite all that, traders must also be aware of fake breakouts and be ready to accept the fact of being wrong in drawing some of the patterns, especially at the beginning. Trading with patterns can be both fun and rewarding.

