
The essence of momentum trading strategies is spotting waves of energy in the market and hopping on at just the right time.
But how do you know when the wave is coming? That’s where momentum indicators come in. Let’s dive into the best momentum indicators, their formulas, and how to use them to surf those market waves.
What Is Momentum Trading?
At its core, momentum trading is simple:
- Spot a trend.
- Ride the trend.
- Exit before the trend fizzles out.
The beauty of this strategy is that it’s adaptable to both short-term intraday trading and longer-term setups. But success depends on using the right momentum indicator strategy to confirm the strength and direction of the trend.
IQ Option offers a special Momentum indicators category featuring the best tools to spot that momentum:
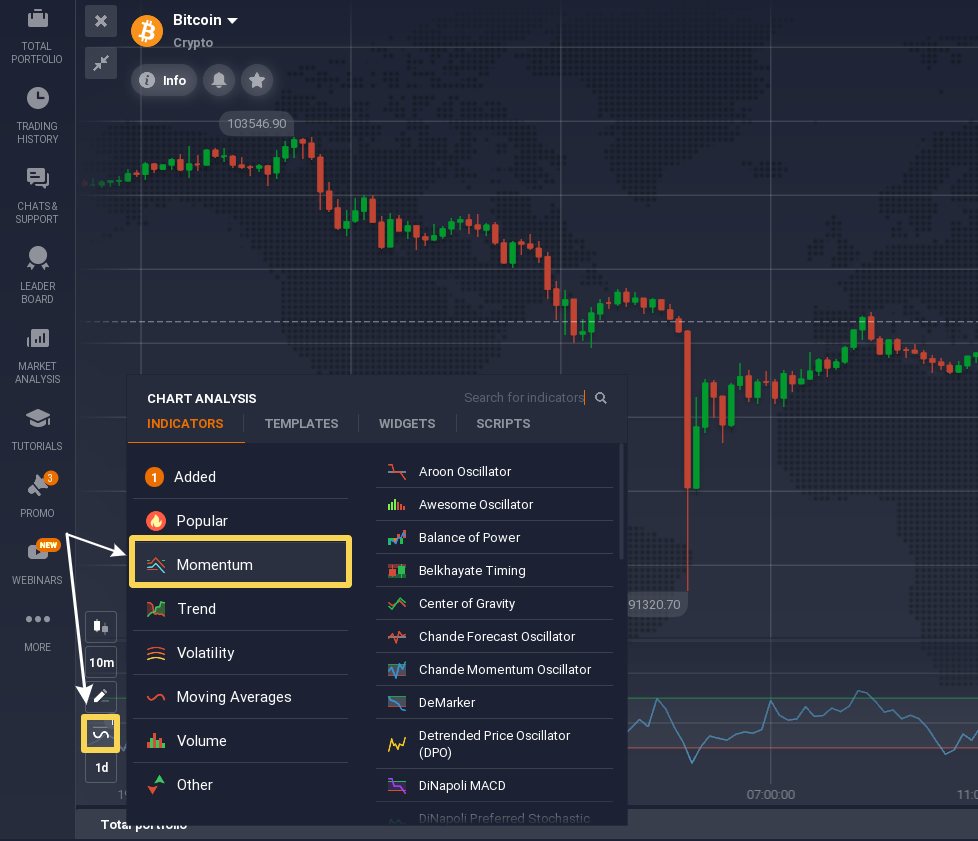
You can test different tools to pick the optimal solution for you. But first, you’ll need to learn how they work.
7 Best Momentum Indicators
We’ve already talked about some popular momentum indicators, such as the Awesome Oscillator. Now, let’s break down some other indicators that might be useful for momentum trading.
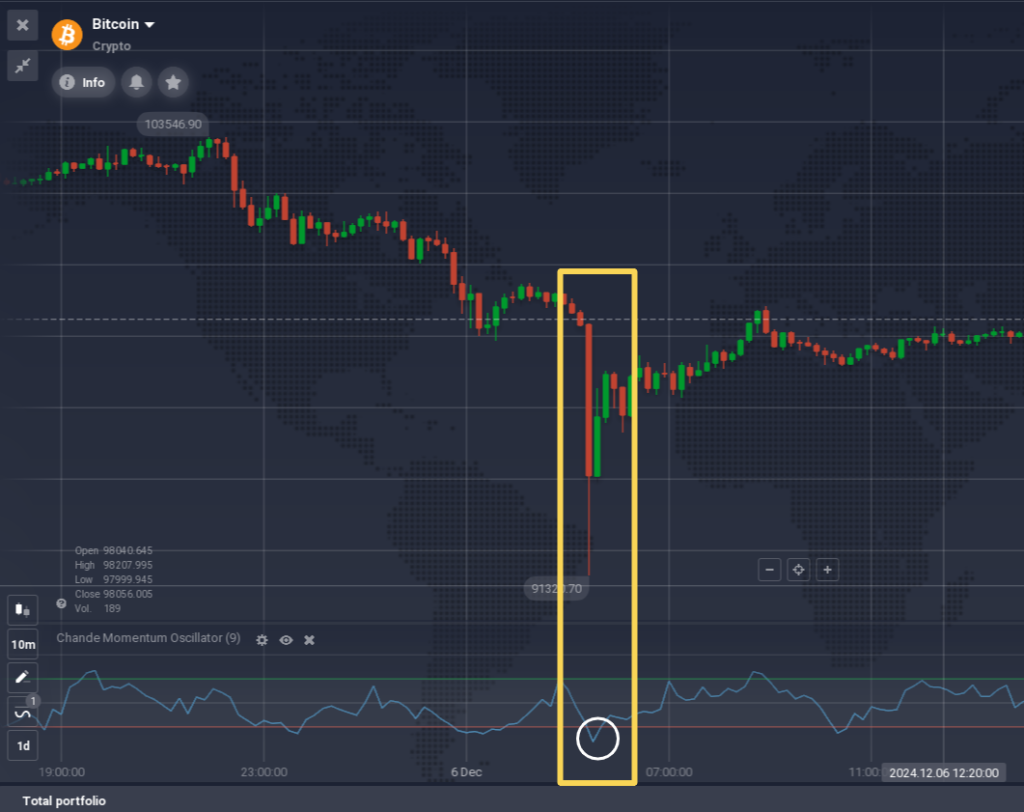
1. Chande Momentum Oscillator (CMO)
Think of the CMO as the cool cousin of the RSI (Relative Strength Index). Created by Tushar Chande, this indicator measures the difference between recent gains and losses. But unlike RSI, it’s not bound between 0 and 100. This makes it more sensitive to sudden price movements.
Key Features:
- Purpose: Detect overbought or oversold conditions in the market.
- Settings: Use a 14-period for most setups, but shorter periods (e.g., 9) can work for fast-moving markets.
- Signals:
- Above +50 = the asset is overbought, strong bullish momentum.
- Below -50 = strong bearish momentum, the asset is oversold.
How It’s Different:
Unlike RSI, the CMO isn’t normalized, meaning it reacts more dynamically to price changes, making it better for volatile markets.
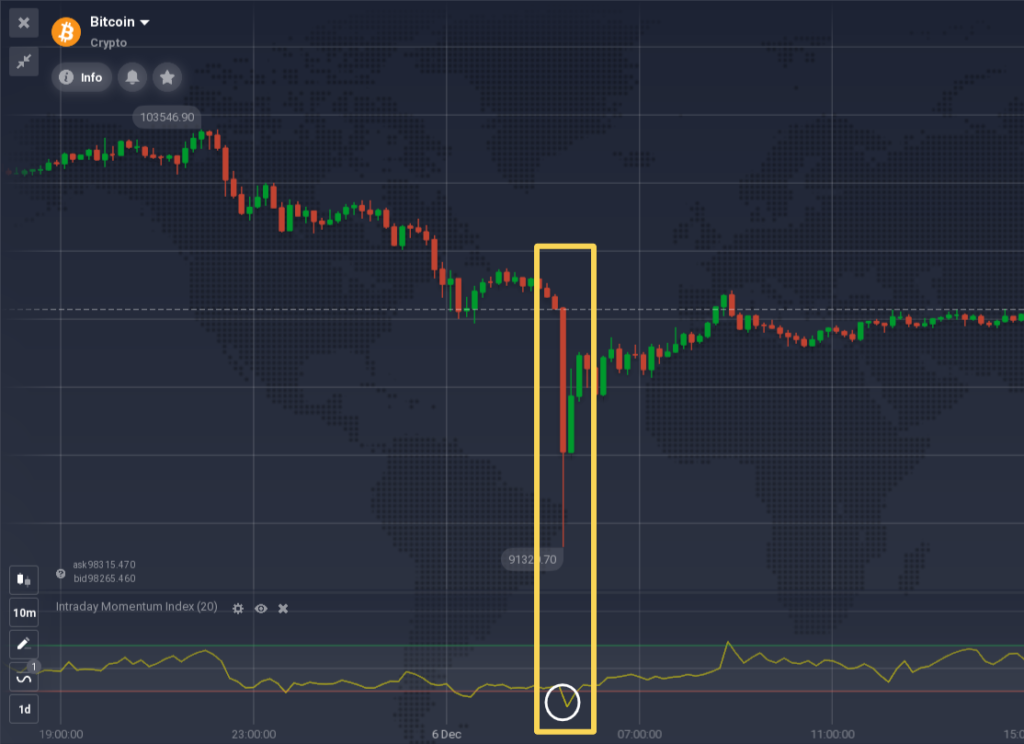
2. Intraday Momentum Index (IMI)
The IMI is like a hybrid between a momentum indicator and a candlestick analysis tool. It’s perfect for intraday traders who want to catch short-term moves.
Key Features:
- Purpose: Spot intraday overbought or oversold conditions.
- Settings: Use the default 14-period for most stocks.
- Signals:
- IMI > 70 = overbought, potential sell signal.
- IMI < 30 = oversold, potential buy signal.
How It’s Different:
Unlike traditional momentum indicators, the IMI incorporates both open-close price differences and the day’s overall range, giving it a unique twist for day trading.

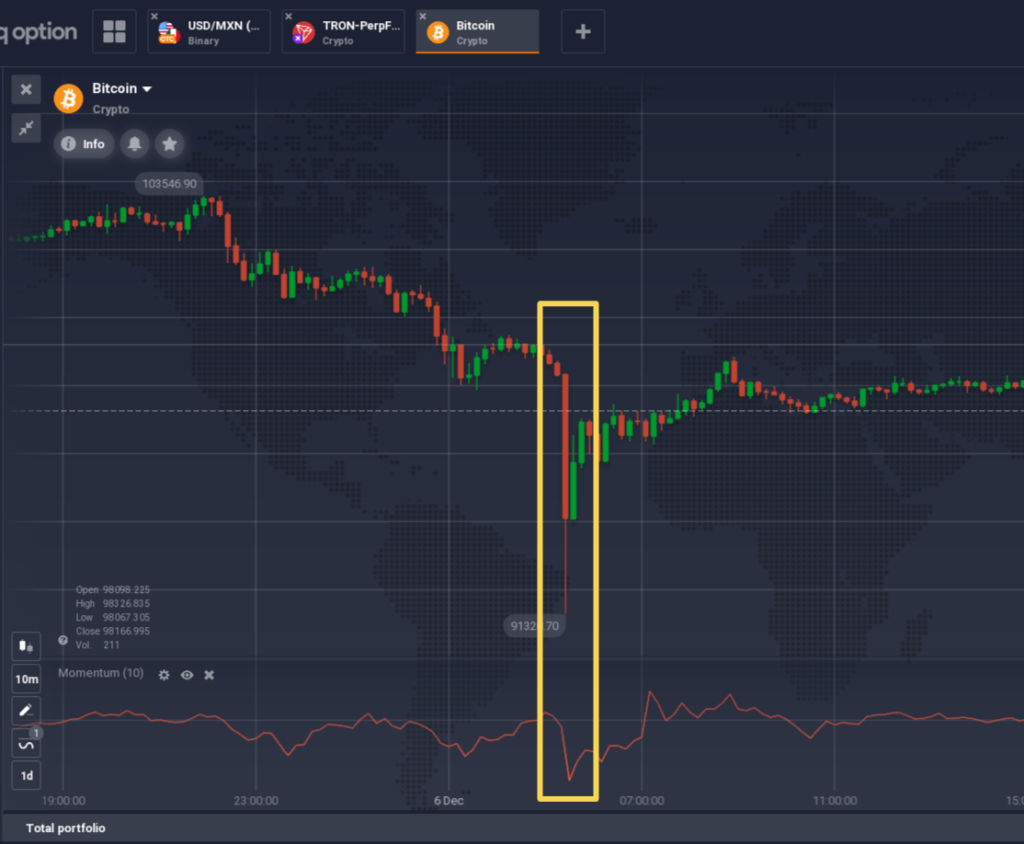
3. Momentum Indicator (Plain and Simple)
The father of momentum indicators, this tool simply measures the rate of change in price over a specified period.
Key Features:
- Purpose: Gauge the speed of a price movement.
- Settings: A 10- or 14-period setting works best for most markets.
- Signals:
- Above zero = bullish momentum.
- Below zero = bearish momentum.
How It’s Different:
It’s the most straightforward tool for momentum traders. If you’re new to a momentum trading strategy, start here.
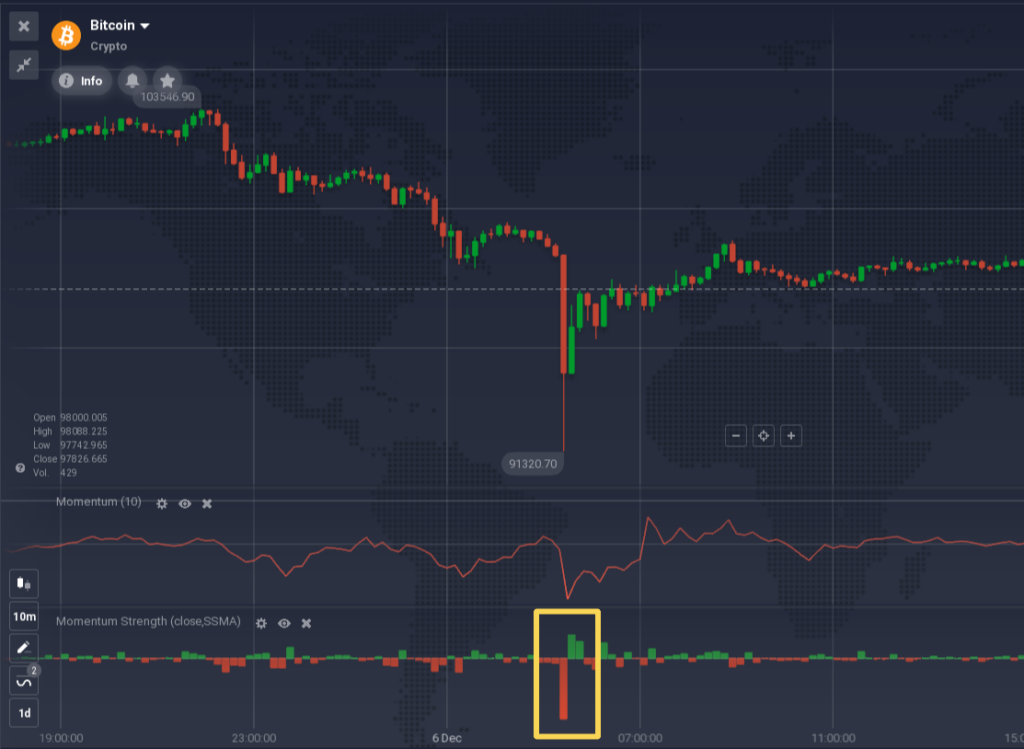
4. Momentum Strength Indicator
This one’s like a turbocharged momentum gauge. It doesn’t just show the trend; it tells you how strong it is.
Key Features:
- Purpose: Quantify the intensity of market momentum.
- Settings: Adjust the period based on your trading style (shorter for intraday, longer for swing trading).
- Signals:
- Increasing values = strengthening trend.
- Decreasing values = trend losing steam.
You can use this indicator along with the basic Momentum to confirm the signal.
How It’s Different:
While most momentum indicators focus on direction, this one emphasizes strength, giving you confidence in trend durability.
5. Price Momentum Oscillator (PMO)
The PMO is like a smoothed-out, zen-like momentum indicator. It helps eliminate noise and gives clear, actionable signals.
Key Features:
- Purpose: Identify smoother momentum trends.
- Settings: Use the standard 35-period for swing trading or adjust for shorter timeframes.
- Signals:
- Crosses above the zero line = bullish signal.
- Crosses below the zero line = bearish signal.
How It’s Different:
Its smoothing mechanism reduces false signals, making it perfect for choppy markets.
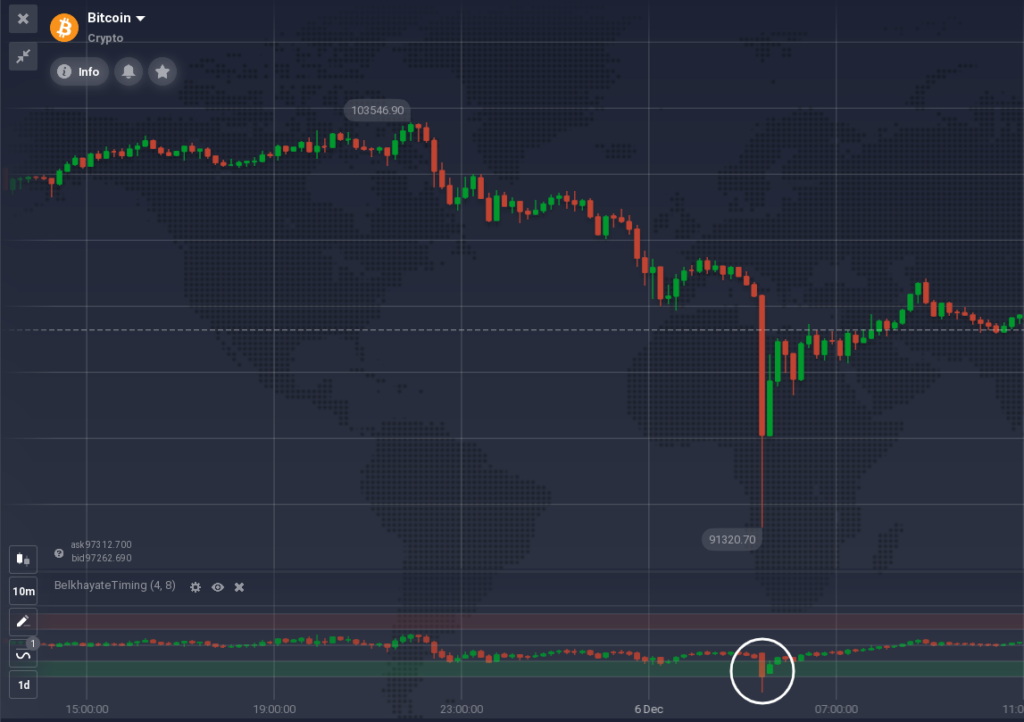
6. Belkhayate Timing Indicator (BTI)
Developed by Gilbert Belkhayate, this unique tool identifies overbought and oversold conditions with precision, helping traders time their entries and exits effectively. By integrating the Belkhayate Timing indicator into your strategy, you can refine your timing and minimize false signals.
Key Features:
- Purpose: Spot overbought or oversold conditions to anticipate reversals.
- Settings: The standard setup works well for most markets, but experienced traders can tweak it for specific assets or timeframes.
- Signals:
- When the indicator moves above the upper threshold, the market is likely overbought — consider shorting or exiting.
- When it falls below the lower threshold, the market is oversold — look for buying opportunities.
How It’s Different:
The BTI stands out because it not only highlights potential reversal zones but also accounts for market dynamics over time, making it more adaptive to changing conditions. Unlike simpler oscillators, it adjusts its thresholds dynamically, offering a nuanced approach to momentum trading.
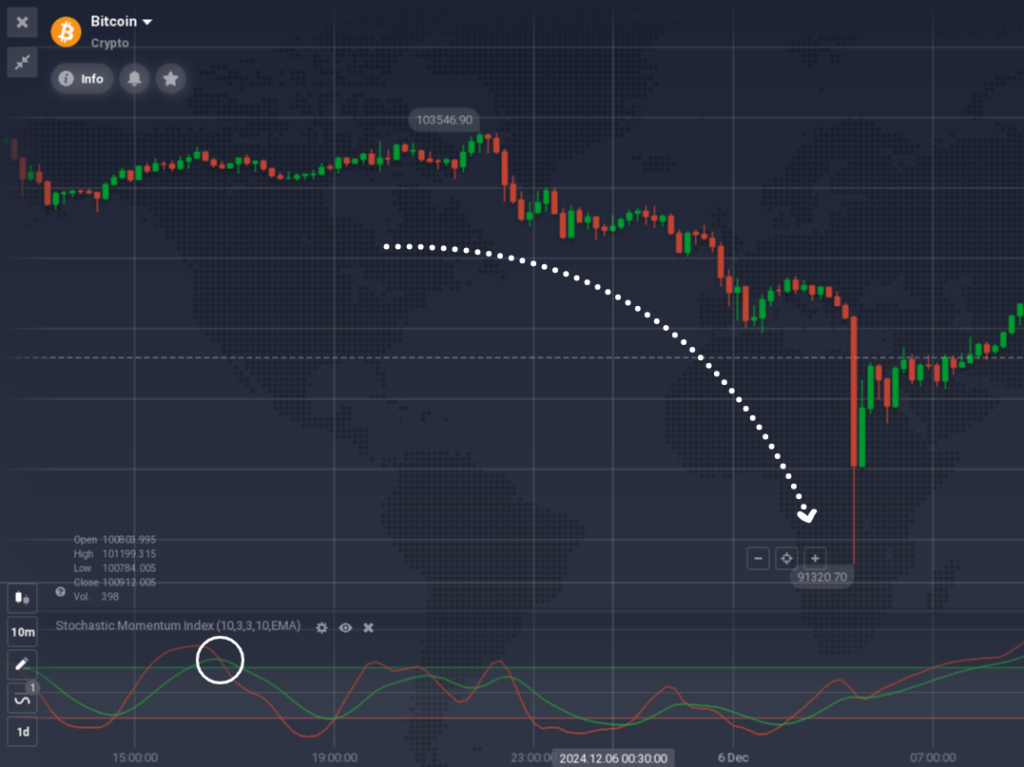
7. Stochastic Momentum Index (SMI)
The SMI is like a refined version of the stochastic oscillator. It gives a more detailed view of momentum by tracking price relative to its range.
Key Features:
- Purpose: Pinpoint overbought and oversold levels with precision.
- Settings: Default settings work well, but experiment with smoothing for added clarity.
- Signals:
- The red line crosses the green one above +40 = overbought, potential sell.
- The lines cross below -40 = oversold, potential buy.
How It’s Different:
Its greater sensitivity compared to the traditional stochastic makes it a sharper tool for timing entries and exits.
Which Is the Best Momentum Indicator?
There’s no one-size-fits-all. Each indicator shines in different market conditions and timeframes. A solid momentum indicator strategy often involves combining a few tools to confirm signals. For instance:
- Use the Squeeze Momentum Indicator to spot breakout opportunities.
- Pair it with the Chande Momentum Oscillator for trend confirmation.
- Add the Price Momentum Oscillator to smooth out noise.
Momentum Trading Strategy: Putting It All Together
Here’s a simple trading plan:
- Use your chosen momentum indicator formula to identify trends.
- Confirm the trend strength with a second indicator (e.g., Momentum Strength).
- Watch for entry signals like zero-line crosses or squeezes.
- Set clear risk levels to protect your capital.
Momentum trading is all about stacking probabilities in your favor. So grab your tools, fine-tune your settings, and get ready to ride those market waves!

