
Experienced traders know: the more tools you can comfortably use for market analysis, the higher your chances of success are. It doesn’t mean that you should be implementing them all at once — that could actually make things worse. It means that you are able to adapt the correct tools to your personal strategy and the market conditions you are working with.
To operate with the best suited tools every time, you need to know about many of them and understand how they work. Today we will be talking about the Moving Average Convergence Divergence (MACD) indicator: one of the most popular tools for technical analysis.
Overview
MACD is one of the simplest momentum indicators to exist. It may help a trader to spot trends as well as apply better technical analysis to all assets. It is used to determine the current trend, its strength and the probability of its reversal.
Essentially, MACD shows the correlation between two Moving Averages for an asset’s price.

There are several important components that make this indicator such a powerful tool:
The MACD line (blue) shows the difference between two EMA lines of different periods:12-period and 26-period. When this line crosses the zero line, it means that there is no difference between the EMAs at the moment. The bigger the difference, the further the MACD line is from the zero line.
The signal line (orange) is a smooth MACD line. By default, the average value of the previous 9 periods is used for its calculation. This line acts as a slow Moving Average, which is crossed by the faster MACD line, resulting in signals, which we will look into.
The histogram shows the distance between the signal line and the MACD line. It changes its position regarding the zero line depending on the trend direction of an asset. If the price is heading upwards, the bars are above the base line. If the trend is descending, the bars will be placed below the line. The color of the bars signals whether the bullish or bearish momentum prevails.
How to read the signals?
There are two indications which a trader should be looking for, both are crossovers:
- A crossover of the signal and MACD lines. When the MACD line (fast) crosses the signal line (slow) downwards, it is a signal that a downtrend is starting and a trader may consider selling the asset. When the MACD line crosses the signal line upwards, it means that the price might reverse its direction and go up, leaving the trader a possibility to purchase the asset.
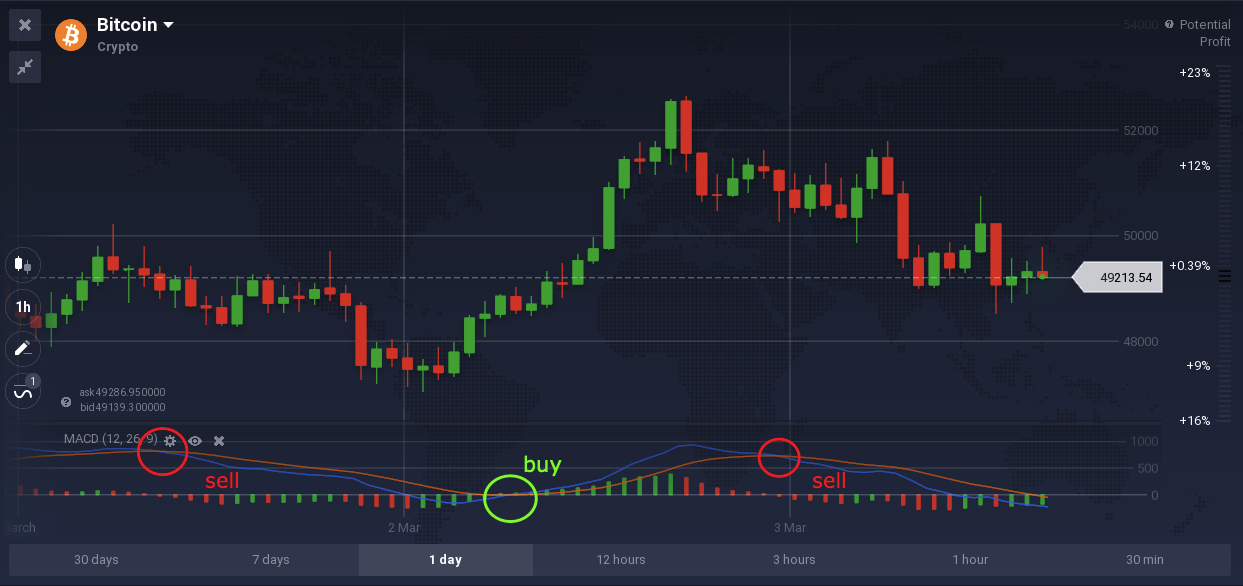
For example, in the screenshot above we can see three crossings: two bearish ones, where the MACD line (blue) crosses the signal line (orange) from above down, and one bullish crossing from below above.
- A crossover of the central (zero) line. An uptrend is expected when the fast line is moving above the zero line in an upwards direction. In case the fast line is moving below the centerline and turned downwards, it might be a sign of a downtrend. With this approach, the crossover of the zero line by MACD is the sign of a change in trend.

In the example we can see the MACD line is first moving downwards below the zero line, then it is changing its direction and moving upwards above the zero line.
By combining the two approaches, traders can confirm the signals the indicator gives out. Checking the histogram may provide an additional clue as to where the price might be heading next.
Divergence
When talking about MACD, it is absolutely necessary to mention divergence. Divergence might appear when the indicator and the chart show different or opposite signals. There are two types of divergence that may occur.
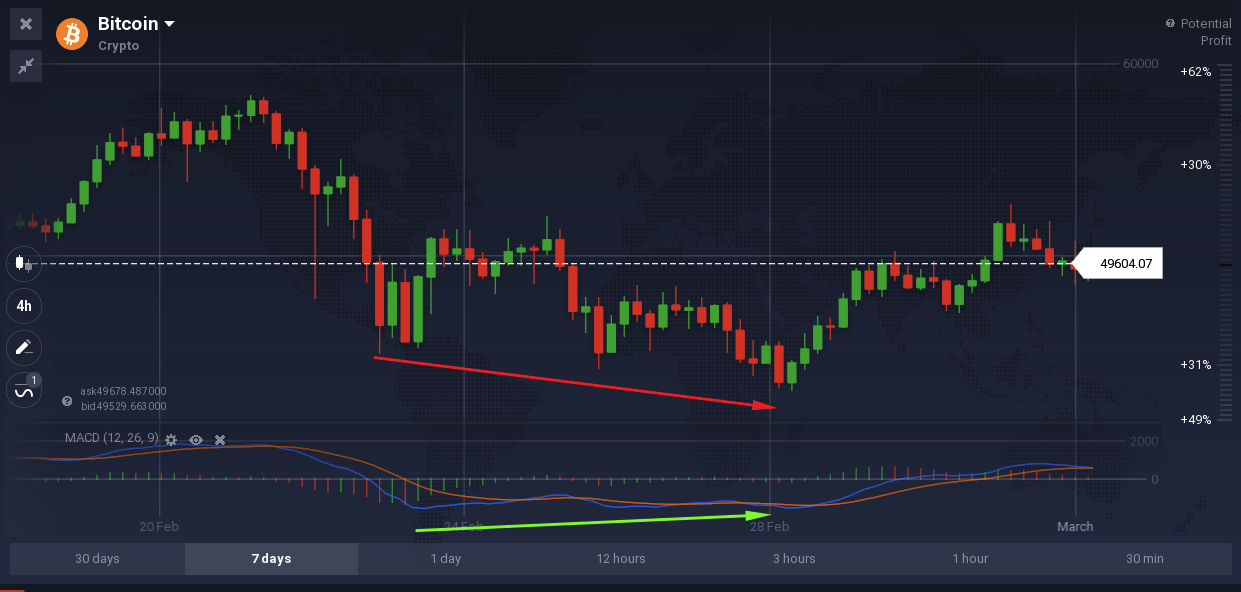
- Positive divergence. This can occur in a situation where the price reaches a new low on the chart, however MACD doesn’t reach a new low. This can be a signal for a bullish trend, a sign that a reversal can be expected.
- Negative divergence. An opposite occurrence — where the asset price is reaching a new high, but the indicator does not, could mean that a bearish trend is anticipated.
It is important to remember that divergence is not always a valid signal and sometimes the indicator can give out false signals. This is why it is important to double check the signals and utilize strong risk management techniques to possibly minimize the losses.
The MACD is an incredibly efficient indicator, which combines qualities of a trend-following and a momentum indicator. Combined with the simplicity in usage, it makes this powerful tool one of the top favorites for many professional and beginner traders.

