
The Fractal indicator might sound intimidating, but once you get the hang of it, it’s one of those tools that makes you wonder how you ever traded without it. Let’s see what fractals look like and how to use the Fractal indicator strategy in trading.
What Are Fractals?
A fractal is a small pattern that repeats within larger patterns. Fractals help identify potential reversals or continuations in price movements. Think of it like an early warning system. The reason it’s so popular among traders is because it gives you a heads-up on when the market might be about to pivot.
In technical analysis, a fractal is formed when price action creates a specific shape on a chart. The pattern is made up of five or more consecutive bars. Here’s what it looks like:
- The bullish fractal happens when there’s a low point surrounded by two higher lows on either side. It’s like a tiny “V” shape nestled in your price chart.
- The bearish fractal is the opposite. This is a high point flanked by two lower highs, forming an upside-down “V.”

Once you spot these, you’ve got a pretty good hint about where the market might head next.
The Fractal Indicator Explained
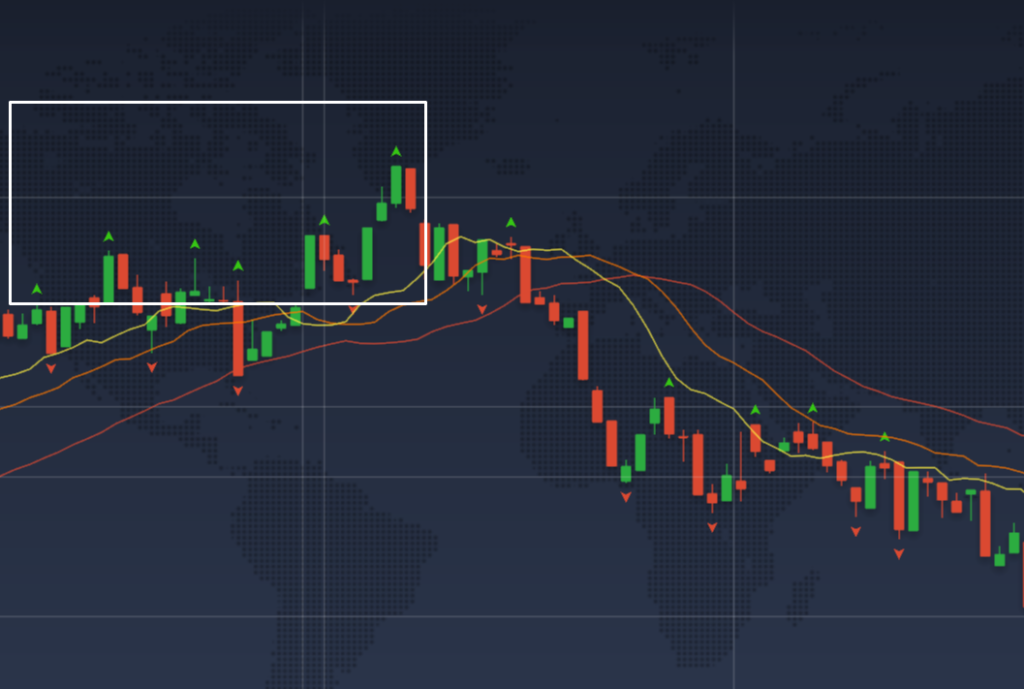
The Fractal indicator does the heavy lifting for you, automatically highlighting these patterns with little arrows:
⬆️ Up arrows for bullish fractals, hinting at potential buying opportunities
⬇️Down arrows for bearish fractals, possibly signaling a selling point

This makes spotting key market shifts much easier without going cross-eyed from staring at price bars all day.
How to Use the Fractal Indicator in Your Trading Strategy
Now that we’ve got the fractal indicator explained, let’s talk about how to use it in real-life trading. Fractals alone aren’t enough to guide your trading decisions. But when used with other tools like Moving Averages or Alligator, they can form a strong trading strategy.
Moving Average + Fractal indicator strategy
- Find a Trend
First, identify the market’s overall trend. Are we in an uptrend, downtrend, or is the market flat? Fractals tend to be more useful when you already have a sense of direction. - Look for Fractals
Once you know the trend, start looking for those fractal signals on your chart.
– If you’re in an uptrend, pay attention to bullish fractals (the “V” shapes).
– In a downtrend, look for bearish fractals (those upside-down “V” formations). - Confirm with MA
Don’t just jump into a trade because you see a fractal. Use other indicators to confirm your entry point.
– If a bullish fractal forms in an uptrend, check if the price is also breaking above a moving average.
– If a bearish fractal appears in a downtrend, check if the price is breaking below the MA line. - Enter the Trade
Once you’ve confirmed the fractal signal, it’s time to enter the trade. Go long with the bullish signals, and short with the bearish ones.

Alligator + Fractal indicator strategy
- Find a Trend and Fractals
Identify the market’s overall trend and look for the fractal signals on your chart. - Confirm with the Alligator indicator
– Fractal’s bullish signals can be considered valid if they appear below the Alligator’s central line (orange).
– Bearish signals should be above the Alligator’s orange line.
Fractal Indicator Strategy: Binary Options Edition
One big advantage is that fractals show up in all time frames. Whether you prefer long-term or short-term positions, fractals can be useful.
If you’re into binary options trading, fractals can be an especially powerful tool.
When you see a bullish fractal during a strong uptrend, you might place a call option, betting that the price will keep climbing within the set expiration period.

For bearish fractals in a downtrend, you’d go with a put option, expecting the price to drop.

Final Thoughts
Fractals might sound complicated at first, but once you’ve got the fractal indicator explained and start using it, you’ll see how it can fit into your trading toolbox. It’s a pattern-recognition indicator that helps highlight potential turning points in the market. Just make sure to back your fractal indicator strategy with confirmation indicators like Moving Average or Alligator to filter out false alarms.

