
Fibonacci Lines are a popular and very powerful technical analysis tool that you can use with downward and upward trends, as well as in conjunction with all assets and timeframes. It’s represented on a price chart as a group of horizontal lines that correspond to the Fibonacci ratios of 23.6%, 38.2%, 50%, 61.8% and 100%. Traders can use these lines as a part of a technical analysis method called Fibonacci retracement. This approach helps determine support and resistance levels. When used correctly, it can allow traders to pick the right moment to enter a deal. Let’s take a closer look at this strategy.
How to use Fibonacci Retracement
In order to make the best use of Fibonacci Retracement strategy, we first have to understand the logistics behind it.
What do the support and resistance levels represent? These are psychological barriers that the price action is believed to test whilst moving in a particular direction. When the price approaches these levels, the trend may either continue its movement, or it can bounce back and reverse. Some experts believe that the trend reversals happen more often when around retracement lines.
A retracement is a short-term price movement that goes against the trend. Fibonacci lines are excellent at identifying these types of movements. When you learn how to use Fibonacci retracement, you’ll be able to spot both the buying and selling opportunities.
☝️
Fibonacci Retracement Settings
Fibonacci Retracement settings are simple and easy to adjust depending on the trend direction and your goals. Here we will show you how to use the Fibonacci retracement tool in the IQ Option traderoom.
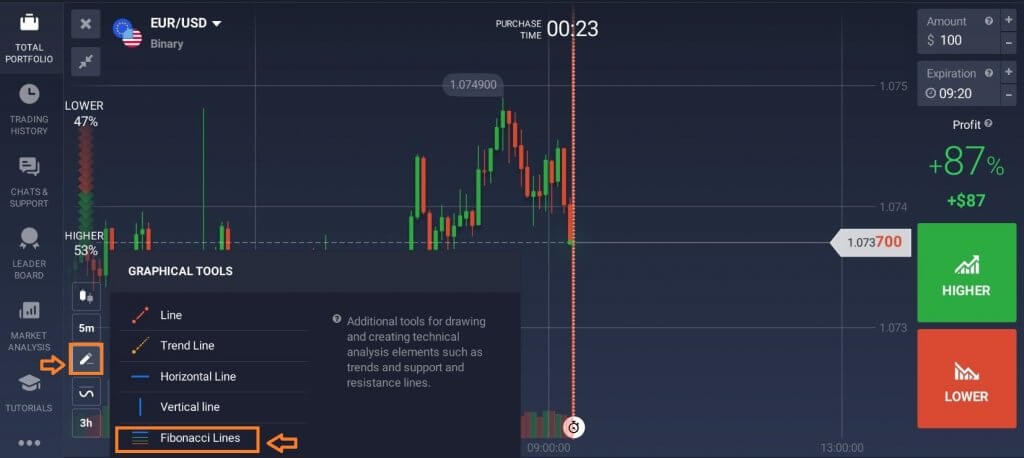
1. Click on the ‘Graphical tools’ button and choose ‘Fibonacci Lines’ from the list of tools.
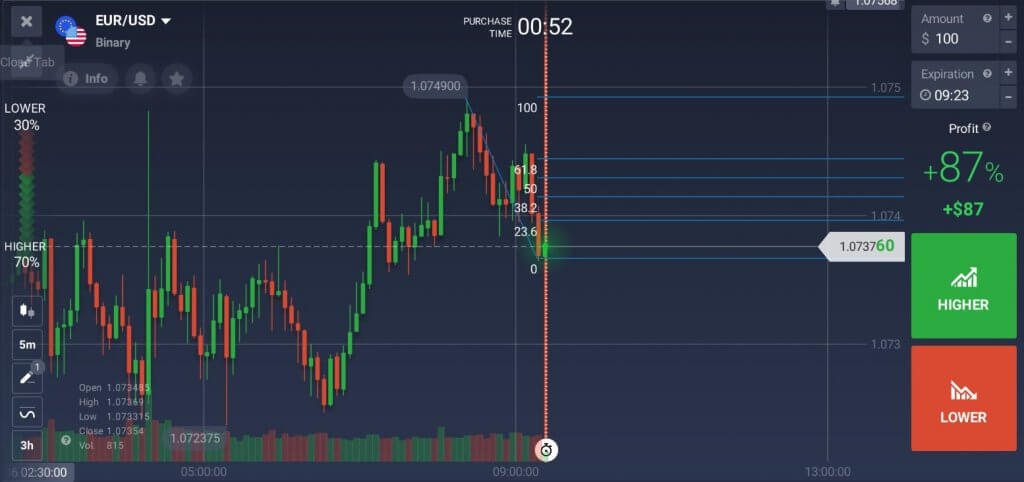
2. Find the most recent swing highs and swing lows. For downtrends, click on the swing high and drag the cursor to the most recent swing low. For uptrends, do the opposite.
3. Fibonacci lines will now appear on the chart.
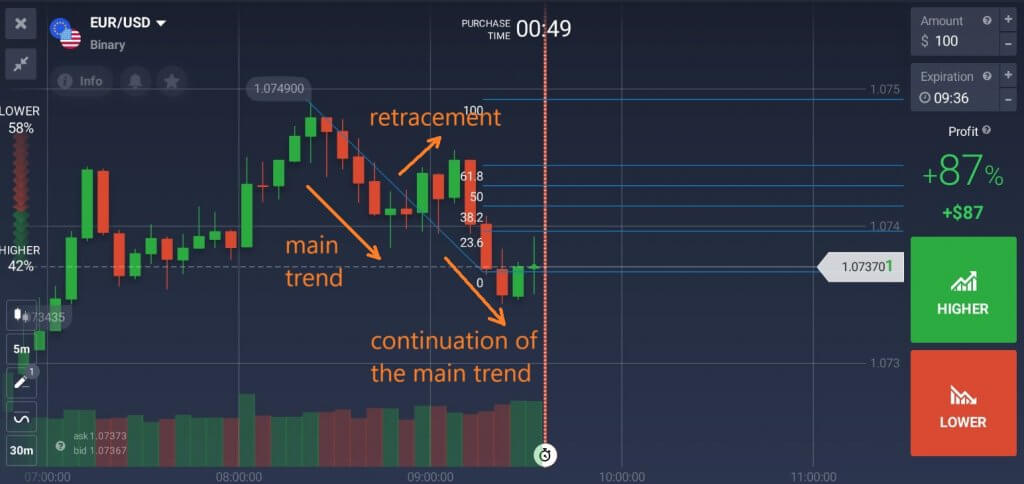
Once you’ve set up the Fibonacci retracement tool, you can start looking for potential trading opportunities.
Keep an eye out for cases when the asset price line reaches one of the Fibonacci lines and bounces from it. This might be the moment to enter a trade before the price swings back in the direction of the main trend.
Some traders believe that the retracement level of 61.8 is the most important, which can also be explained by basic market psychology. The potential for price swings is higher due to extensive buying and selling pressure (depending on the trend direction).
Please keep in mind that retracement can be confused with trend reversals, which is a major change in the trend direction. In case of Fibonacci retracement, you are looking for smaller swings against the main trend, not a complete reversal in the opposite direction.
Conclusion
Fibonacci is an interesting technical analysis tool, albeit with limited, but useful functionality. Fibonacci Lines can help identify the best entry points during the retracements. Traders, however, have to bear in mind that the support and resistance levels given by this tool aren’t always foolproof. They merely represent ‘areas of interest’. Fibonacci Retracement doesn’t provide enough information to be used as a leading indicator, but you may find it a helpful tool for making medium to long-term decisions.

