
“Oh I wish I knew about this huge uptrend/downtrend before it happened,” — how many times have you told yourself that while looking at the big moves in price history?
All regrets aside — there are many ways to get this sacred knowledge before everything happened. Bollinger Bands + Keltner Channels + Momentum Oscillator combo aka Bollinger Squeeze strategy gives you a chance to trade the breakout at the very beginning of a trend.
What is Bollinger Squeeze?
Bollinger Squeeze is an indicator combination described by John F. Carter in his book Mastering The Trade. It helps catch big moves after volatility rises in a quiet market, i.e., trade with the trend.
The combo consists of 3 indicators:
- Bollinger Bands shows the direction and range of price fluctuations.
- Keltner Channels helps to identify the trend and its reversals.
- Momentum Oscillator measures how much an asset price has changed over a given period.
When combined, these three indicators signal that a big increase in volatility is coming.
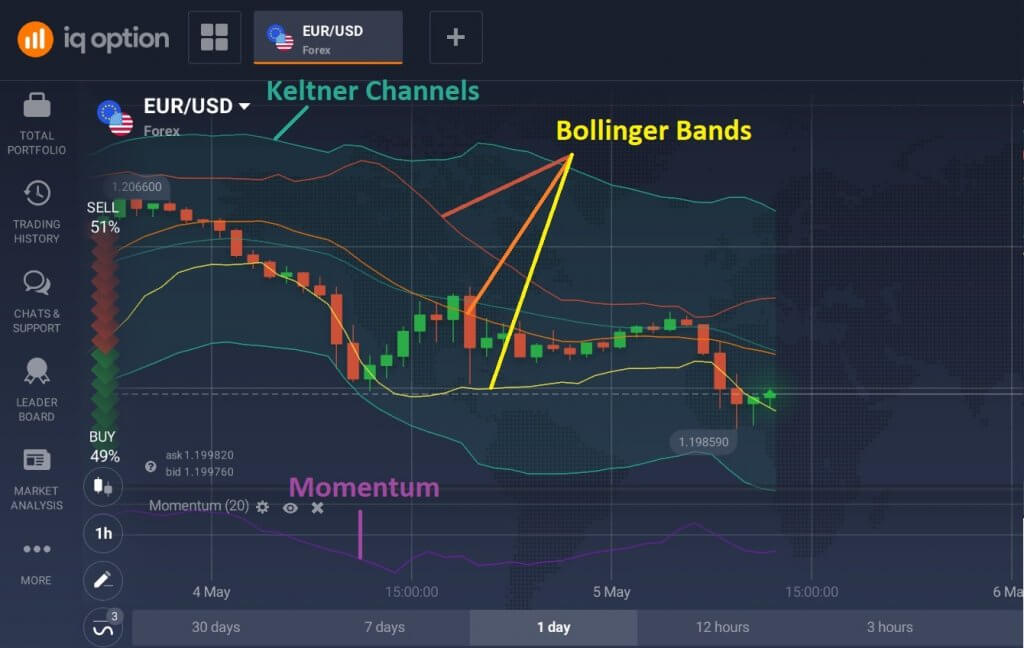
Although the combo looks a little crazy on the chart, it gives a great visual representation of what’s going on:
A squeeze occurs when Bollinger Bands tighten up enough to slip inside the Keltner Channels. When that happens, you know the market is in a period of extreme consolidation and highly likely ready for a large move.
When you see Bollinger Bands go inside the Keltner Channels, all you need to do is wait until they break out and check the Momentum signal to decide on the direction of the trade.
How to use Bollinger Squeeze
Bollinger Squeeze works well for currency pairs, cryptocurrencies, and stocks. All you need to do is add and set up 3 indicators and watch the signals they give.
To add the indicators on your IQ Option chart, go to the Indicators section in the bottom left corner of the traderoom and configure the settings as indicated below.
Also, don’t forget to set up Stop-Loss and Take-Profit levels for your trades to take risks under control.
1. Keltner Channels
Period: 20
Offset: 1,5
Moving Average: EMA
The Keltner Channels is a trend indicator that helps determine the very beginning of a trend. Unlike non-specialized Bollinger Bands, the primary purpose of which is to graphically show the range of the quotations’ movement, Keltner Channels have a much higher level of accuracy.
The indicator consists of three lines. The one in the middle is a 10-day Simple Moving Average for “typical” prices. Two additional lines are calculated by adding and subtracting the moving average daily price range from the middle line. Altogether, they shape up a “corridor” based on volatility.

2. Bollinger Bands
Period: 20
Deviation: 2
Bollinger Bands combine a trend indicator, a volatility indicator, and an oscillator. The bands indicate the direction and range of price fluctuations on the chart, taking the trend and volatility characteristic of the current phase of the market into account.
Graphically, the indicator consists of three lines:
- The Moving Average in the middle characterizes the main direction of movement;
- Two lines that limit the price chart on both sides and characterize its volatility.
This is what your chart should look like on the IQ Option platform after adding Bollinger Bands to the previously set Keltner Channels:

The chart clearly displays where the orange, red and yellow Bollinger bands narrow down, ending up inside the Keltner channels. This is how you know that the market is preparing for some kind of massive move.
But in which direction?
This is what the last indicator aims to determine.
3. Momentum oscillator
Period: 20
Source: Candle closing
The Momentum oscillator measures how much an asset price has changed over a certain period. When applied, the indicator is visible as a line that ranges between 0 and 100, moving up and down.
In the Bollinger Squeeze combination, the Momentum oscillator will identify the direction of the trend and deliver a signal to buy or sell.
How to read the signals
1. Wait for all three Bollinger Bands to go within the upper and lower bands of the Keltner Channels.
2. Spot the moment when the Bollinger Bands move out of the Keltner Channels.
3. Check the Momentum Oscillator:
- If it is above zero, press Buy at the close of the candle.
- If it is below zero, press Sell at the close of the candle.
4. Close the trade when the Momentum Oscillator shows a weakening in momentum:
- If you’re in a bullish trade, close it when the Momentum Oscillator goes below zero.
- If you’re in a bearish trade, close it when the Momentum goes above zero.
Example of a bullish trade
In the following example for EUR/USD, all three lines of the Bollinger Bands indicator get inside the channel the moment the red line slips in.
To open a trade, you need to wait until the Bollinger Bands begin to go out of the blue “corridor”. When this eventually happens, check the Momentum — in our example it is above zero, which is a buy signal. The trade should be opened at the end of the candle.
After that, you see how the price begins to rise and continues to go up until the moment when the Momentum slides down beyond the zero mark. This is a signal to close the trade.
Example of a bearish trade
This time, all three of the Bollinger Bands got into the Keltner Channel almost simultaneously. Soon after, the red and yellow lines started getting out of the channel. At this moment, the Momentum oscillator was below the zero level, which is a signal to sell.

You can see how the price started to go down after that — up until the moment when Momentum broke the zero level from below and went up. This is the right moment to close the position.
Conclusion
Bollinger Squeeze is a killer system if you want to trade the breakout as the trend just begins to shape up. Thanks to it, you’ll be able to open positions early on and maximize your potential profits.
Bollinger Squeeze is technically 3 indicators fused together: Bollinger Bands + Keltner Channels + Momentum Oscillator. When Bollinger Bands slip inside the Keltner Channels and then break out of them, you need to check the Momentum signal and open a trade in the corresponding direction.
Importantly, Bollinger Squeeze works for different asset classes and timeframes. Don’t forget to set Stop-Loss and Take-Profit!

