
Fibonacci lines is one of the most famous technical analysis tools used by traders all over the world. It helps to forecast the length of the current price trend and possible price reversals in the future. This tool can be useful in predicting what the best time to enter the market is and when it is time to step out. Fibonacci lines contribute to identifying support and resistance lines which allow gaining the maximum profit from the opened deals. If you wish to learn how to trade with Fibonacci, keep on reading.
Where to find and how to apply
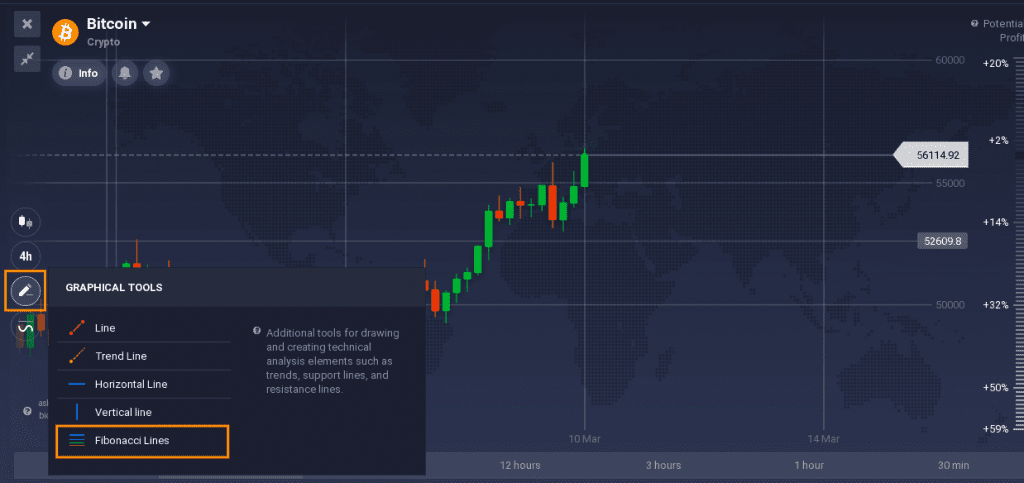
You can find Fibonacci Lines in the left-hand bottom corner in the Graphical Tools menu on the IQ Option platform.
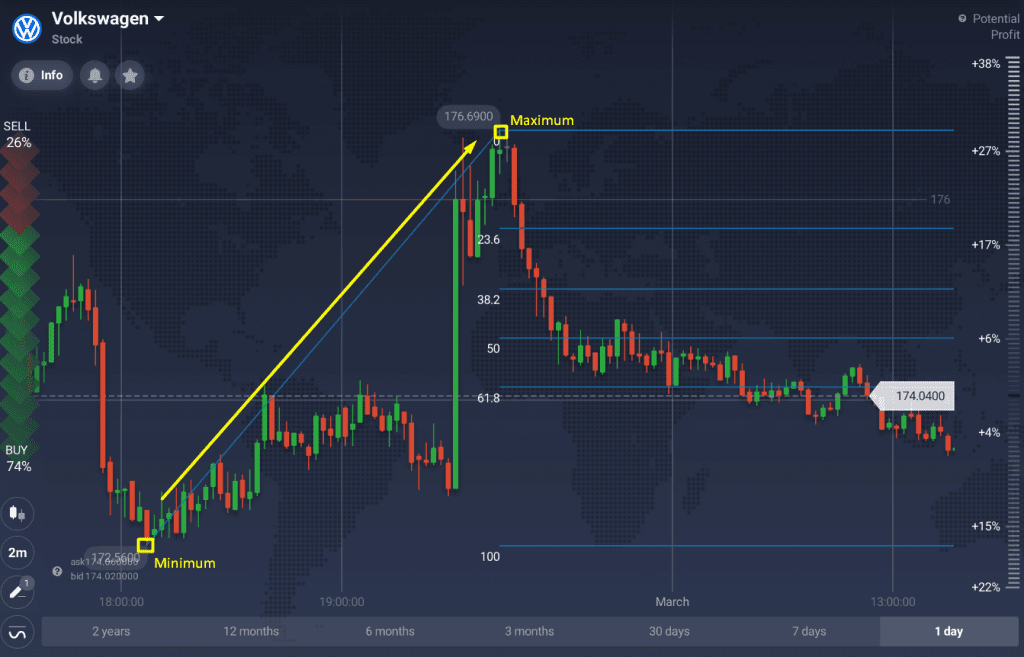
- To apply the tool correctly for an upward trend, choose the minimum and the maximum points for a certain period and connect them with the Fibonacci Lines from 100 till 0 accordingly.
To do that, you need to find the minimum price within the selected time period and click on it. The minimum price is often highlighted on the chart. After that, you need to drag a line to the maximum price that should be on the right side from the minimum price. Finally, Fibonacci lines will be reflected and you will be ready to use them.
- For a downward trend, you need to do the same but to the opposite side.
First, you should find the maximum price and click on it. Then, indicate the minimum price on the right side from the maximum price and connect these two points.
Once you do that, the Fibonacci lines are ready to use.

Pay attention to put a line exactly on the minimum and the maximum points, especially if you use candles or bar chart types.
How to read the lines
So, how to trade with Fibonacci and how to read the signals of this tool? First of all, it is important to understand what this instrument represents.
This tool consists of horizontal lines that correspond to Fibonacci ratios of 23.6, 38.2, 50, 61.8, and 100. These levels are employed to determine possible support and resistance levels of the ongoing price trend. Also, you can forecast whether the trend is likely to change when the price reaches them.
During an uptrend, Fibonacci Retracement can be used as a buy signal during the pullback. During a downtrend, Fibonacci lines can be used to determine optimal short selling positions.
If the price has breached the level of:
- 23.6 or 38.2 – most likely, the trend will continue
- 50 – the trend can either continue or change
- 61.8 – there is a high probability that a trend will change
For example, here it is seen that the trend has changed from downward to upward after breaching the 61.8 level.

Remember if you are using Fibonacci lines for long-term trading you can also use these levels to set up Stop Loss. If you are planning to enter the market at levels 23.6-38.2, it makes sense to set up a Stop Loss at level 0 – for a buy deal or level 50 for a sell deal. Thus, you can cut your potential losses.
The Volkswagen asset example
Let’s take a look at the Volkswagen asset and check how the trend could have been potentially predicted with Fibonacci Lines. We have indicated that the Volkswagen asset has a downward trend and applied the graphical tool accordingly.
The first thing we can see (1) is that the price mostly fluctuates between levels 23.6 and 38.2. Thus, we indicated 23.6 as the main support line and 38.2 as the main resistant line.
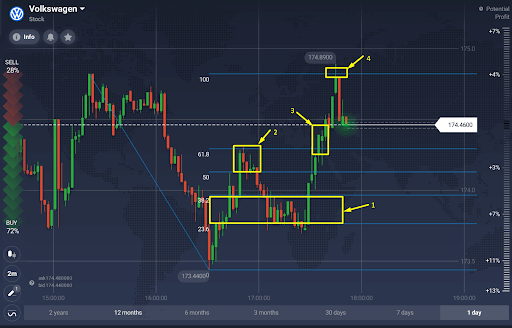
After breaching 38.2 and 50 levels we are waiting for the price to test the level and show whether the trend is going to continue or reverse. When the price reaches 61.8 level (2) it bounces back, and the downward trend continues.
Further on the price reaches 61.8 level and continues to grow (3) – that means that the trend has changed to the upward one.
And finally, when the price hits 100 level (4) which is also known as the strong resistance level – the price trend changes back to downward.
According to these levels, we can indicate areas where we could receive signals to enter or exit the market. Nevertheless, it is crucial to remember that Fibonacci lines show only the areas and not the signals themselves, so in order to utilize it wisely you might want to use it together with other indicators. For instance, many traders combine this graphical tool with such indicators as ADX and Parabolic SAR.
Conclusion
Fibonacci lines are a great complementary graphical tool for identifying the possible trend reversal, its strength, and the areas where the signals are most likely to be found. The main role of that tool is to show whether the current trend is a new trend or just the correction of the previous one and whether it may soon reverse back to the initial level.
Combining this graphical tool with other indicators may considerably enhance any trading approach, regardless of your trading habits.

